Exchange Traded Fund Calculator
ETF cost & return calculator • 2026 analysis
ETF Details
Advanced Options
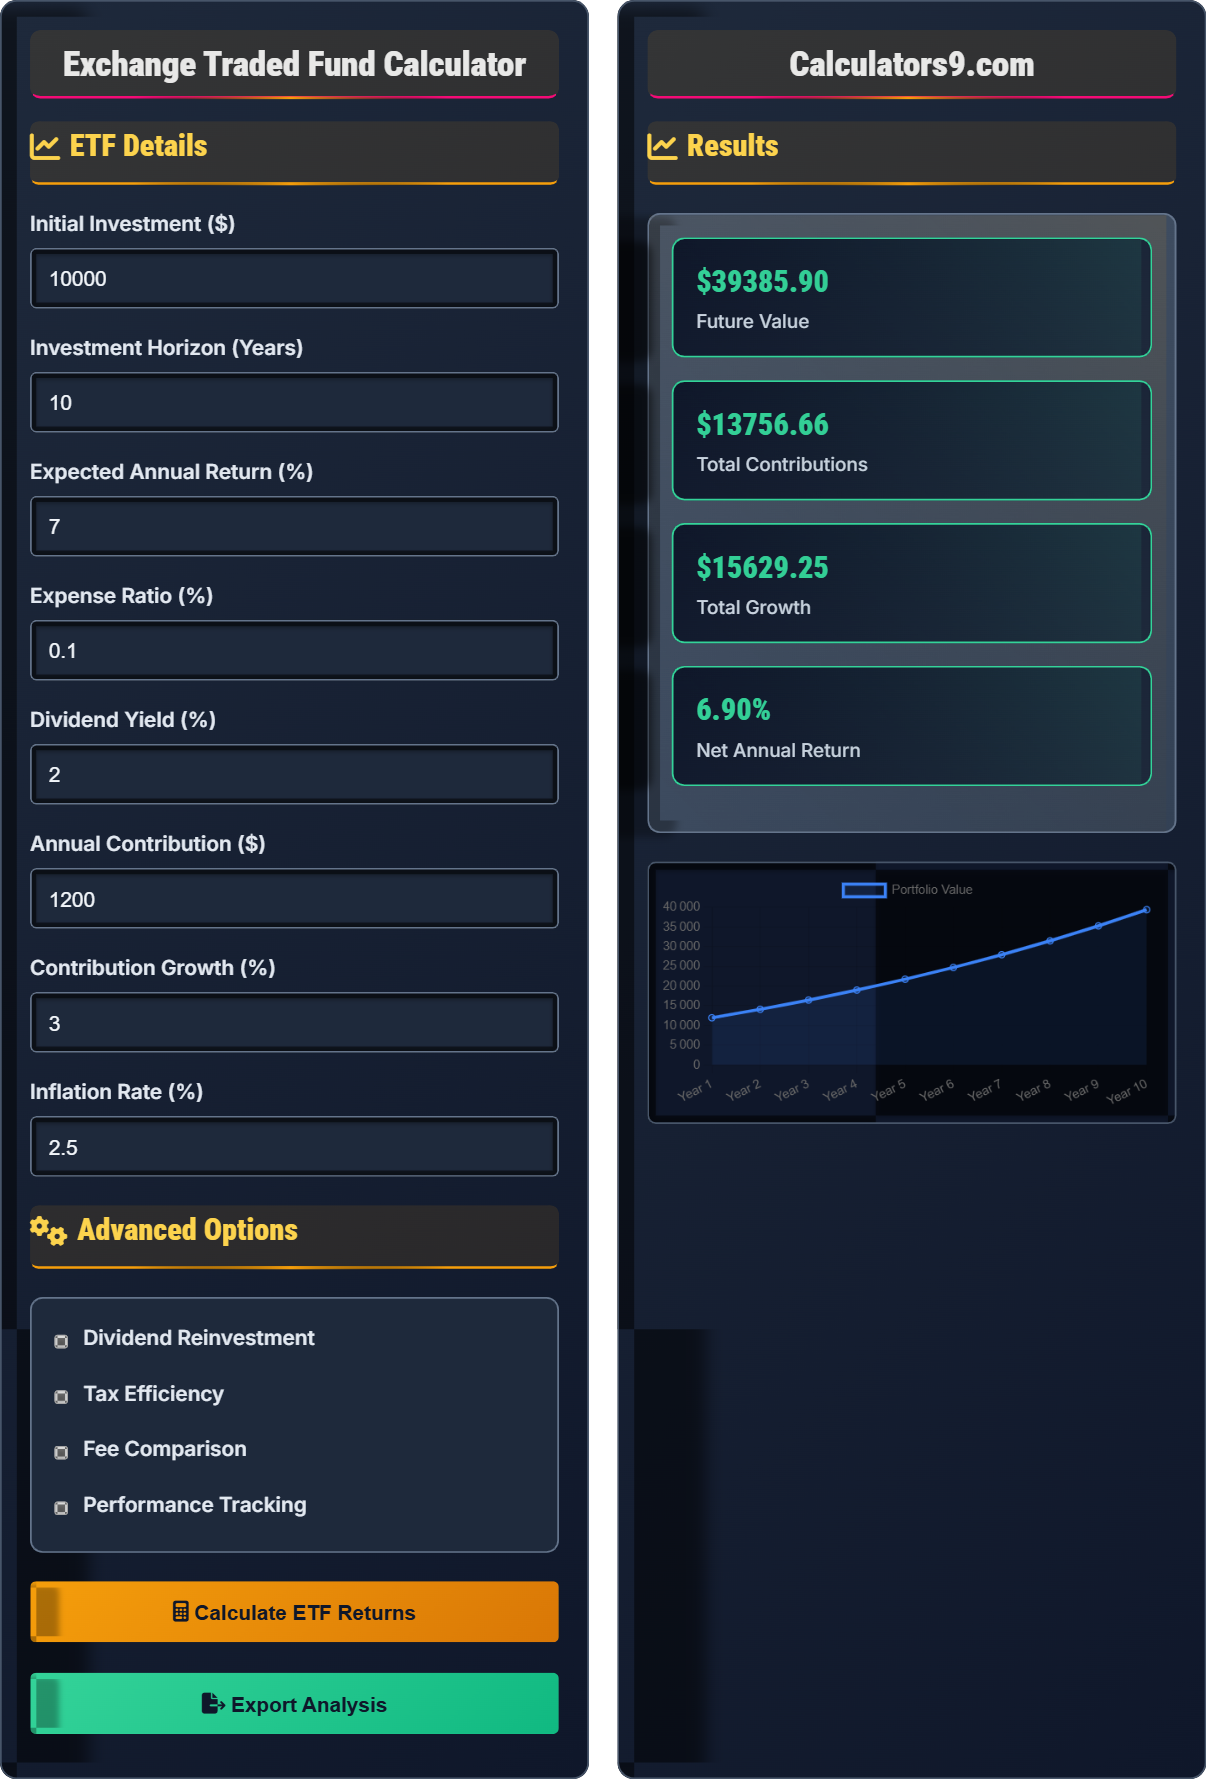
Results
| Year | Starting Value | Contribution | Return | Ending Value |
|---|
| Metric | Value | Impact |
|---|
Comprehensive ETF Guide
An Exchange Traded Fund (ETF) is a type of investment fund that holds a collection of securities—such as stocks, bonds, or commodities—and trades on a stock exchange like a single stock. ETFs offer diversification, liquidity, and typically lower costs compared to mutual funds. They track various indices, sectors, or asset classes, providing investors with broad market exposure in a single transaction.
The primary costs associated with ETFs include:
For a $10,000 investment at 7% gross return and 0.1% expense ratio: $700 return - $10 in fees = $690 net return (6.9% net).
Major ETF categories include:
- Index ETFs: Track market indices (S&P 500, Russell 2000)
- Bond ETFs: Government, corporate, municipal bonds
- Sector ETFs: Technology, healthcare, energy
- Commodity ETFs: Gold, oil, agricultural products
- International ETFs: Developed/emerging market exposure
- Size Matters: Larger AUM typically means better liquidity
- Expense Ratio: Lower costs compound over time
- Tracking Error: How closely ETF follows index
- Trading Volume: Ensures tight bid-ask spreads
- Provider Reputation: Established managers with proven track records
ETF Learning Quiz
Which of the following is a key difference between ETFs and mutual funds?
The answer is B) ETFs trade continuously during market hours. ETFs trade like stocks throughout the trading day, while mutual funds are priced once daily after market close. This allows ETFs to be bought and sold at any time during market hours, unlike mutual funds which only transact at the end-of-day NAV.
This distinction is fundamental to ETF functionality. The continuous pricing mechanism of ETFs allows for intraday trading flexibility and real-time pricing transparency. This differs significantly from mutual funds which use a single daily price (NAV) calculated after market close.
ETF: Exchange Traded Fund - trades like stock
NAV: Net Asset Value - mutual fund pricing mechanism
Continuous Trading: Ability to trade anytime during market hours
• ETFs trade intra-day like stocks
• Mutual funds trade once daily at NAV
• ETFs typically have lower expense ratios
• Use limit orders for ETF trades to control price
• Assuming ETFs and mutual funds trade similarly
• Not considering bid-ask spreads
• Ignoring trading costs in addition to expense ratios
Calculate the difference in returns between two identical ETFs with different expense ratios: ETF A (0.1% ER) and ETF B (0.8% ER) over 10 years with $50,000 initial investment and 7% annual return.
For ETF A (0.1% ER):
Net return = 7% - 0.1% = 6.9%
Future value = $50,000 × (1.069)^10 = $97,161
For ETF B (0.8% ER):
Net return = 7% - 0.8% = 6.2%
Future value = $50,000 × (1.062)^10 = $90,701
Difference = $97,161 - $90,701 = $6,460
Over 10 years, the 0.7% difference in expense ratios results in a $6,460 difference in portfolio value.
This demonstrates the significant impact of expense ratios on long-term investment returns. The seemingly small 0.7% difference compounds to over $6,000 in lost value over 10 years. This is why expense ratio is a critical factor in ETF selection, as small differences compound dramatically over time.
Expense Ratio: Annual fee as percentage of assets
Compounding: Growth on previous growth
Net Return: Gross return minus fees
• Lower expense ratios = Higher net returns
• Fees compound over time
• Small differences become significant over long periods
• Compare expense ratios before investing
• Consider impact over your investment horizon
• Look for funds with ratios below 0.5%
• Underestimating long-term impact of fees
• Not comparing expense ratios between similar funds
• Ignoring compounding effect of fees
You invest $20,000 in an ETF with 2.5% dividend yield and 0.2% expense ratio. If you reinvest dividends for 5 years at 6% total return, what is your final value?
Step 1: Calculate net return after fees
Net return = 6% - 0.2% = 5.8%
Step 2: Calculate growth with dividend reinvestment
Using compound growth formula with reinvested dividends:
Future Value = Principal × (1 + Net Return)^Years
Future Value = $20,000 × (1.058)^5 = $20,000 × 1.325 = $26,500
Without dividend reinvestment, the value would be $20,000 × (1.058)^5 = $26,500. The dividend yield contributes to total return, which is captured in the 6% figure.
This example shows how dividend reinvestment contributes to total return. When dividends are automatically reinvested, they purchase additional shares that generate their own dividends, creating a compounding effect. This accelerates portfolio growth over time compared to taking dividends as cash.
Dividend Reinvestment: Automatic purchase of additional shares
Total Return: Price appreciation + dividends
Compounding: Earning returns on previous returns
• Reinvested dividends increase share count
• More shares generate more dividends
• Compounding accelerates over time
• Use DRIP programs for automatic reinvestment
• Consider tax implications in taxable accounts
• Track total return not just price appreciation
• Not accounting for dividend reinvestment in projections
• Focusing only on price growth
• Forgetting to subtract expense ratios
Compare after-tax returns for an ETF vs mutual fund both earning 8% annually. ETF has 0.1% ER, mutual fund has 0.8% ER. Both distribute $1,000 in capital gains annually. If you're in the 22% tax bracket, how much more do you keep with the ETF after 10 years?
Step 1: Calculate net returns after fees
ETF: 8% - 0.1% = 7.9%
Mutual Fund: 8% - 0.8% = 7.2%
Step 2: Calculate annual tax on distributions
Tax on distributions: $1,000 × 22% = $220 per year
Step 3: Calculate total tax impact over 10 years
ETF: $220 × 10 = $2,200 in taxes
Mutual Fund: $220 × 10 = $2,200 in taxes
Step 4: Calculate final values
ETF: $10,000 × (1.079)^10 - $2,200 = $21,400 - $2,200 = $19,200
Mutual Fund: $10,000 × (1.072)^10 - $2,200 = $20,000 - $2,200 = $17,800
Step 5: Calculate difference
Difference: $19,200 - $17,800 = $1,400
You keep $1,400 more with the ETF after 10 years.
ETFs are generally more tax-efficient than mutual funds due to their unique structure. The in-kind creation/redemption process minimizes capital gains distributions. This example shows how both lower fees and reduced tax liability contribute to better after-tax returns for ETFs.
Tax Efficiency: Minimizing tax impact on returns
Capital Gains Distribution: Taxable distribution of realized gains
Creation/Redemption: ETF structural mechanism
• ETFs generally have fewer capital gains distributions
• Lower expense ratios improve net returns
• Tax efficiency is especially important in taxable accounts
• Use ETFs in taxable accounts for tax efficiency
• Consider tax implications of fund distributions
• Look for funds with low turnover ratios
• Not considering tax implications in taxable accounts
• Ignoring capital gains distributions
• Assuming all investments are equally tax-efficient
What is tracking error in ETFs?
The answer is B) The difference between ETF return and index return. Tracking error measures how closely an ETF follows its underlying index. It's calculated as the standard deviation of the difference between ETF and index returns. Lower tracking error indicates the ETF closely mirrors its benchmark.
Tracking error is a critical measure of ETF quality. It captures various factors that cause an ETF's performance to diverge from its benchmark, including expense ratios, sampling methods, cash drag, and securities lending. Investors should look for ETFs with low tracking error relative to their expense ratio.
Tracking Error: Deviation from benchmark performance
Standard Deviation: Statistical measure of variation
Index Replication: Strategy to match benchmark
• Lower tracking error = Better index replication
• Tracking error is measured in basis points
• Consider tracking error relative to expense ratio
• Compare tracking error across similar funds
• Look for tracking error below 10 basis points
• Consider total cost (expense ratio + tracking error)
• Confusing tracking error with expense ratio
• Not checking tracking error when comparing funds
• Assuming all index-tracking is perfect
ETF Basics
Exchange-traded fund holding diversified securities that trades like a stock.
\(Net\ Return = Gross\ Return - Expense\ Ratio\)
Account for fees in return calculations.
- Lower fees = More compounding
- Trade like stocks during market hours
- Tax-efficient structure
Selection Strategies
Expense ratio, tracking error, AUM, and trading volume matter most.
- Compare expense ratios
- Check tracking error
- Verify AUM adequacy
- Assess liquidity
- Match ETF to investment objective
- Consider tax implications
- Evaluate provider reputation
- Check bid-ask spreads
FAQ
Q: Are ETFs safer than individual stocks?
A: ETFs offer diversification reducing single-stock risk. But market risk remains. For $10K investment: 100 stocks ETF vs 1 stock = 99% less concentration risk.
Q: Best for income?
A: Dividend-focused ETFs like VIG (dividend growth) or VYM (high yield). 3-4% yield with diversification. Individual dividend stocks may offer higher yields but less diversification.