Risk-Return Calculator
Portfolio risk-return analysis • 2026 models
Investment Details
Advanced Options
Results
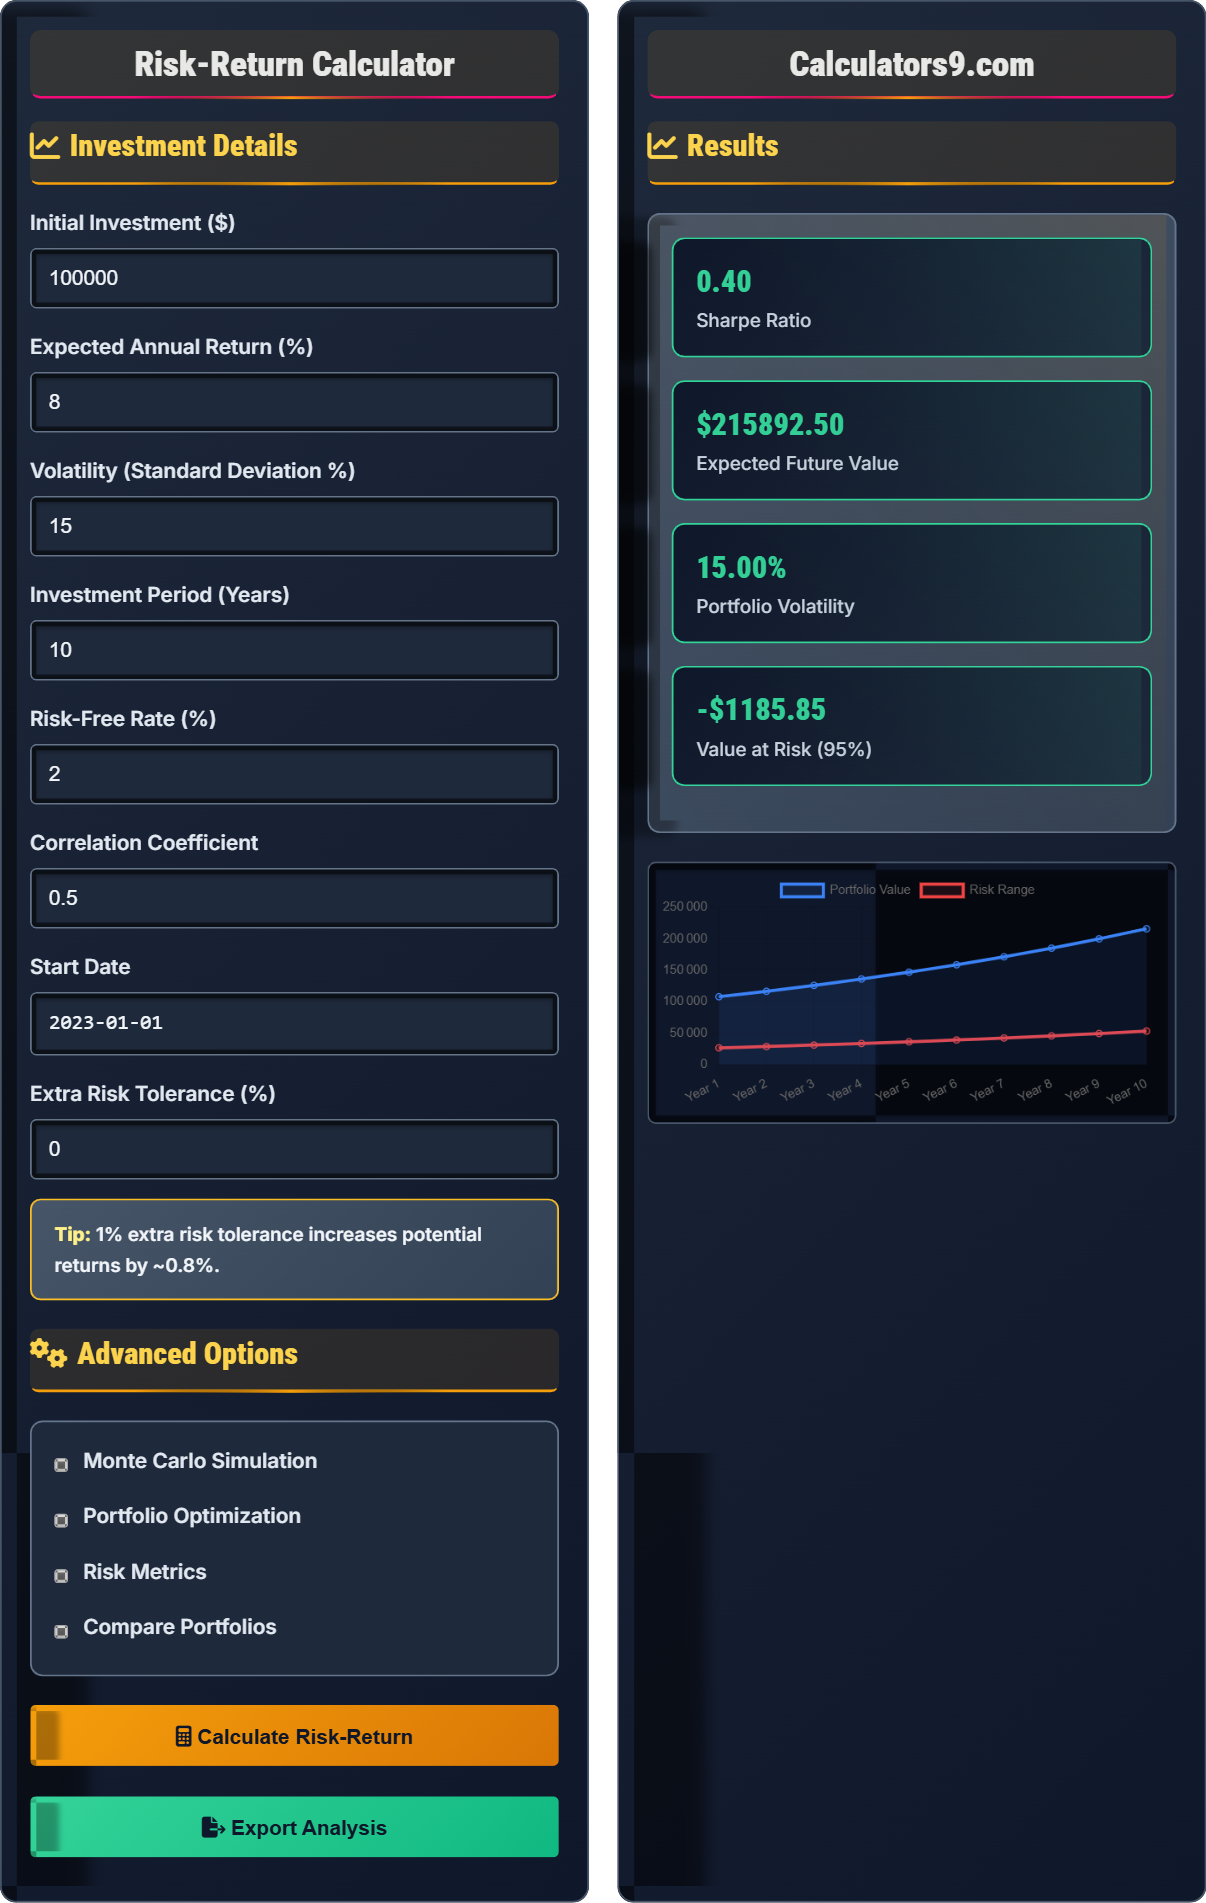
| Metric | Value | Interpretation |
|---|
| Year | Expected Value | Best Case | Worst Case | Volatility Range |
|---|
Comprehensive Risk-Return Guide
The risk-return tradeoff is a fundamental principle in finance stating that potential return rises with an increase in risk. Low levels of uncertainty (low risk) are associated with low potential returns, whereas high levels of uncertainty (high risk) are associated with high potential returns. Investors must balance their desire for the highest possible returns against their tolerance for risk. This relationship forms the basis of modern portfolio theory.
Key risk-return metrics include:
Investment risks can be categorized as:
- Systematic Risk: Market-wide risk that cannot be diversified away
- Unsystematic Risk: Company-specific risk that can be reduced through diversification
- Interest Rate Risk: Risk of bond value decline due to interest rate changes
- Inflation Risk: Risk of purchasing power erosion
- Liquidity Risk: Risk of not being able to sell investment quickly
- Diversification: Spread investments across asset classes and sectors
- Asset Allocation: Balance riskier and safer investments
- Hedging: Use derivatives to offset potential losses
- Stop-Loss Orders: Automatically sell if value drops below threshold
- Time Diversification: Invest regularly over time to reduce timing risk
Risk-Return Learning Quiz
Which risk metric measures the excess return per unit of risk?
The answer is C) Sharpe Ratio. The Sharpe Ratio is calculated as (Portfolio Return - Risk-Free Rate) / Portfolio Standard Deviation. It measures how much excess return you receive for the extra volatility you endure for holding a riskier asset. A higher Sharpe ratio indicates better risk-adjusted performance.
The Sharpe Ratio is a crucial metric for comparing investments with different risk levels. It allows investors to understand if the additional risk they're taking is justified by higher returns. For example, an investment with a 10% return and 15% volatility has a better Sharpe ratio (0.53) than one with 12% return and 25% volatility (0.40), even though the second has higher absolute returns.
Sharpe Ratio: Risk-adjusted return measure
Excess Return: Return above risk-free rate
Volatility: Standard deviation of returns
• Higher Sharpe ratio = Better risk-adjusted return
• Compare investments using Sharpe ratios
• Risk-free rate is typically treasury yield
• Use Sharpe ratio for risk-adjusted comparisons
• Consider risk tolerance when interpreting ratios
• Compare Sharpe ratios within same asset class
• Confusing standard deviation with Sharpe ratio
• Not adjusting for risk-free rate
• Comparing Sharpe ratios across different asset classes
Calculate the Sharpe ratio for a portfolio with 12% return, 18% volatility, and 3% risk-free rate. Show your work.
Using the Sharpe ratio formula: \(Sharpe\ Ratio = \frac{Portfolio\ Return - Risk-Free\ Rate}{Portfolio\ Standard\ Deviation}\)
Given:
- Portfolio Return = 12% or 0.12
- Risk-Free Rate = 3% or 0.03
- Portfolio Standard Deviation = 18% or 0.18
Step 1: Calculate excess return = 12% - 3% = 9% or 0.09
Step 2: Calculate Sharpe Ratio = 0.09 ÷ 0.18 = 0.5
The Sharpe ratio is 0.5, indicating a moderate risk-adjusted return.
This example demonstrates the practical calculation of the Sharpe ratio. The result of 0.5 is considered moderate - typically ratios above 0.7 are considered good, above 1.0 excellent. The calculation shows that while the portfolio has a 12% return, after accounting for the risk-free rate and volatility, the risk-adjusted return is more modest at 0.5.
Excess Return: Return above risk-free rate
Standard Deviation: Measure of return volatility
Risk-Free Rate: Return with zero risk (treasury bills)
• Subtract risk-free rate from portfolio return
• Divide by portfolio volatility (standard deviation)
• Higher Sharpe ratio indicates better performance
• Use treasury yield as risk-free rate
• Annualize returns and volatility for consistency
• Compare Sharpe ratios for same time period
• Forgetting to subtract risk-free rate
• Using wrong volatility measure
• Not annualizing returns properly
Compare two portfolios: Portfolio A has 10% return with 12% volatility. Portfolio B has 14% return with 20% volatility. If the risk-free rate is 2%, which portfolio has the better risk-adjusted return?
Portfolio A:
Excess Return = 10% - 2% = 8%
Sharpe Ratio = 8% ÷ 12% = 0.67
Portfolio B:
Excess Return = 14% - 2% = 12%
Sharpe Ratio = 12% ÷ 20% = 0.60
Portfolio A has a better risk-adjusted return (0.67 vs 0.60) despite the lower absolute return. It generates more excess return per unit of risk taken.
This example illustrates why absolute returns aren't the only factor in investment decisions. Portfolio B has higher returns but also significantly higher risk. When adjusted for risk, Portfolio A is actually the better choice. This demonstrates the importance of considering risk-adjusted returns rather than just looking at raw performance figures.
Risk-Adjusted Return: Return considering risk taken
Excess Return: Return above risk-free rate
Performance Efficiency: Return per unit of risk
• Higher absolute returns don't always mean better investments
• Risk-adjusted metrics provide better comparison
• Consider both return and risk in decisions
• Always consider risk-adjusted returns
• Use Sharpe ratio for consistent comparisons
• Look at both return and volatility
• Focusing only on absolute returns
• Not adjusting for risk when comparing investments
• Ignoring volatility in performance evaluation
A portfolio has 60% in Asset X (8% return, 10% volatility) and 40% in Asset Y (12% return, 15% volatility). If the correlation between them is 0.3, calculate the portfolio's expected return and volatility. How does this demonstrate diversification benefit?
Portfolio Expected Return:
Portfolio Return = (0.6 × 8%) + (0.4 × 12%) = 4.8% + 4.8% = 9.6%
Portfolio Volatility:
Portfolio Variance = w₁²σ₁² + w₂²σ₂² + 2w₁w₂ρσ₁σ₂
= (0.6)²(0.10)² + (0.4)²(0.15)² + 2(0.6)(0.4)(0.3)(0.10)(0.15)
= 0.36(0.01) + 0.16(0.0225) + 2(0.24)(0.3)(0.015)
= 0.0036 + 0.0036 + 0.00216 = 0.00936
Portfolio Volatility = √0.00936 = 0.0967 = 9.67%
Diversification Benefit:
Weighted average volatility = (0.6 × 10%) + (0.4 × 15%) = 12%
Actual portfolio volatility = 9.67%
Diversification reduced risk by 2.33% while maintaining expected return of 9.6%.
This demonstrates the power of diversification - by combining assets with imperfect correlation (0.3), the portfolio achieves the weighted average return (9.6%) but with lower risk (9.67% vs 12% weighted average). The correlation coefficient determines the diversification benefit: lower correlation = greater risk reduction.
Portfolio Weight: Percentage allocation to each asset
Correlation: Measure of how assets move together
Diversification: Risk reduction through asset combination
• Portfolio return = weighted average of asset returns
• Portfolio volatility ≠ weighted average of volatilities
• Lower correlation = greater diversification benefit
• Combine assets with low correlation for maximum diversification
• International diversification reduces correlation
• Rebalance periodically to maintain allocation
• Assuming portfolio volatility is weighted average
• Not considering correlation in diversification
• Overestimating diversification benefits
Which factor is the MOST important consideration when determining appropriate risk level for an investment portfolio?
The answer is B) Investment time horizon. The length of time you have to invest is the most important factor in determining appropriate risk level. Longer time horizons allow investors to ride out market volatility and recover from temporary losses, making higher-risk investments more suitable. Shorter time horizons require more conservative approaches to preserve capital.
Time horizon is fundamental to risk tolerance because it determines your ability to recover from losses. A 30-year investment horizon allows for recovery from significant market downturns, while a 2-year horizon requires capital preservation. This principle underlies modern portfolio theory and is essential for appropriate asset allocation.
Time Horizon: Investment duration before needing funds
Risk Tolerance: Ability to withstand value fluctuations
Capital Preservation: Protecting initial investment amount
• Longer time horizon = Higher risk tolerance
• Shorter time horizon = Lower risk tolerance
• Time horizon is the primary risk factor
• Align risk level with investment timeline
• Reduce risk as time horizon shortens
• Consider both time and risk tolerance
• Not considering investment timeline
• Taking excessive risk near investment horizon
• Assuming all investors have same risk tolerance
Risk-Return Basics
Higher potential returns require accepting higher risk levels.
\(Sharpe\ Ratio = \frac{Return - Risk\ Free\ Rate}{Volatility}\)
Measures excess return per unit of risk.
- Higher returns typically require higher risk
- Diversification reduces unsystematic risk
- Time horizon affects risk tolerance
Risk Management
Systematic (market) vs unsystematic (specific) risk.
- Diversify across asset classes
- Rebalance periodically
- Use stop-loss orders
- Consider hedging strategies
- Risk tolerance varies by individual
- Market conditions affect risk
- Tax implications matter
- Correlation changes over time
FAQ
Q: What's a good Sharpe ratio?
A: Above 0.7 is good, above 1.0 is excellent. For $100K portfolio: 0.7 Sharpe = $7K excess return per $10K risk.
Q: Risk vs reward?
A: Risk: 15% volatility. Reward: 8% return. Higher risk may yield higher rewards, but no guarantee. Diversification reduces risk without sacrificing returns.