Safe Withdrawal Rate Calculator
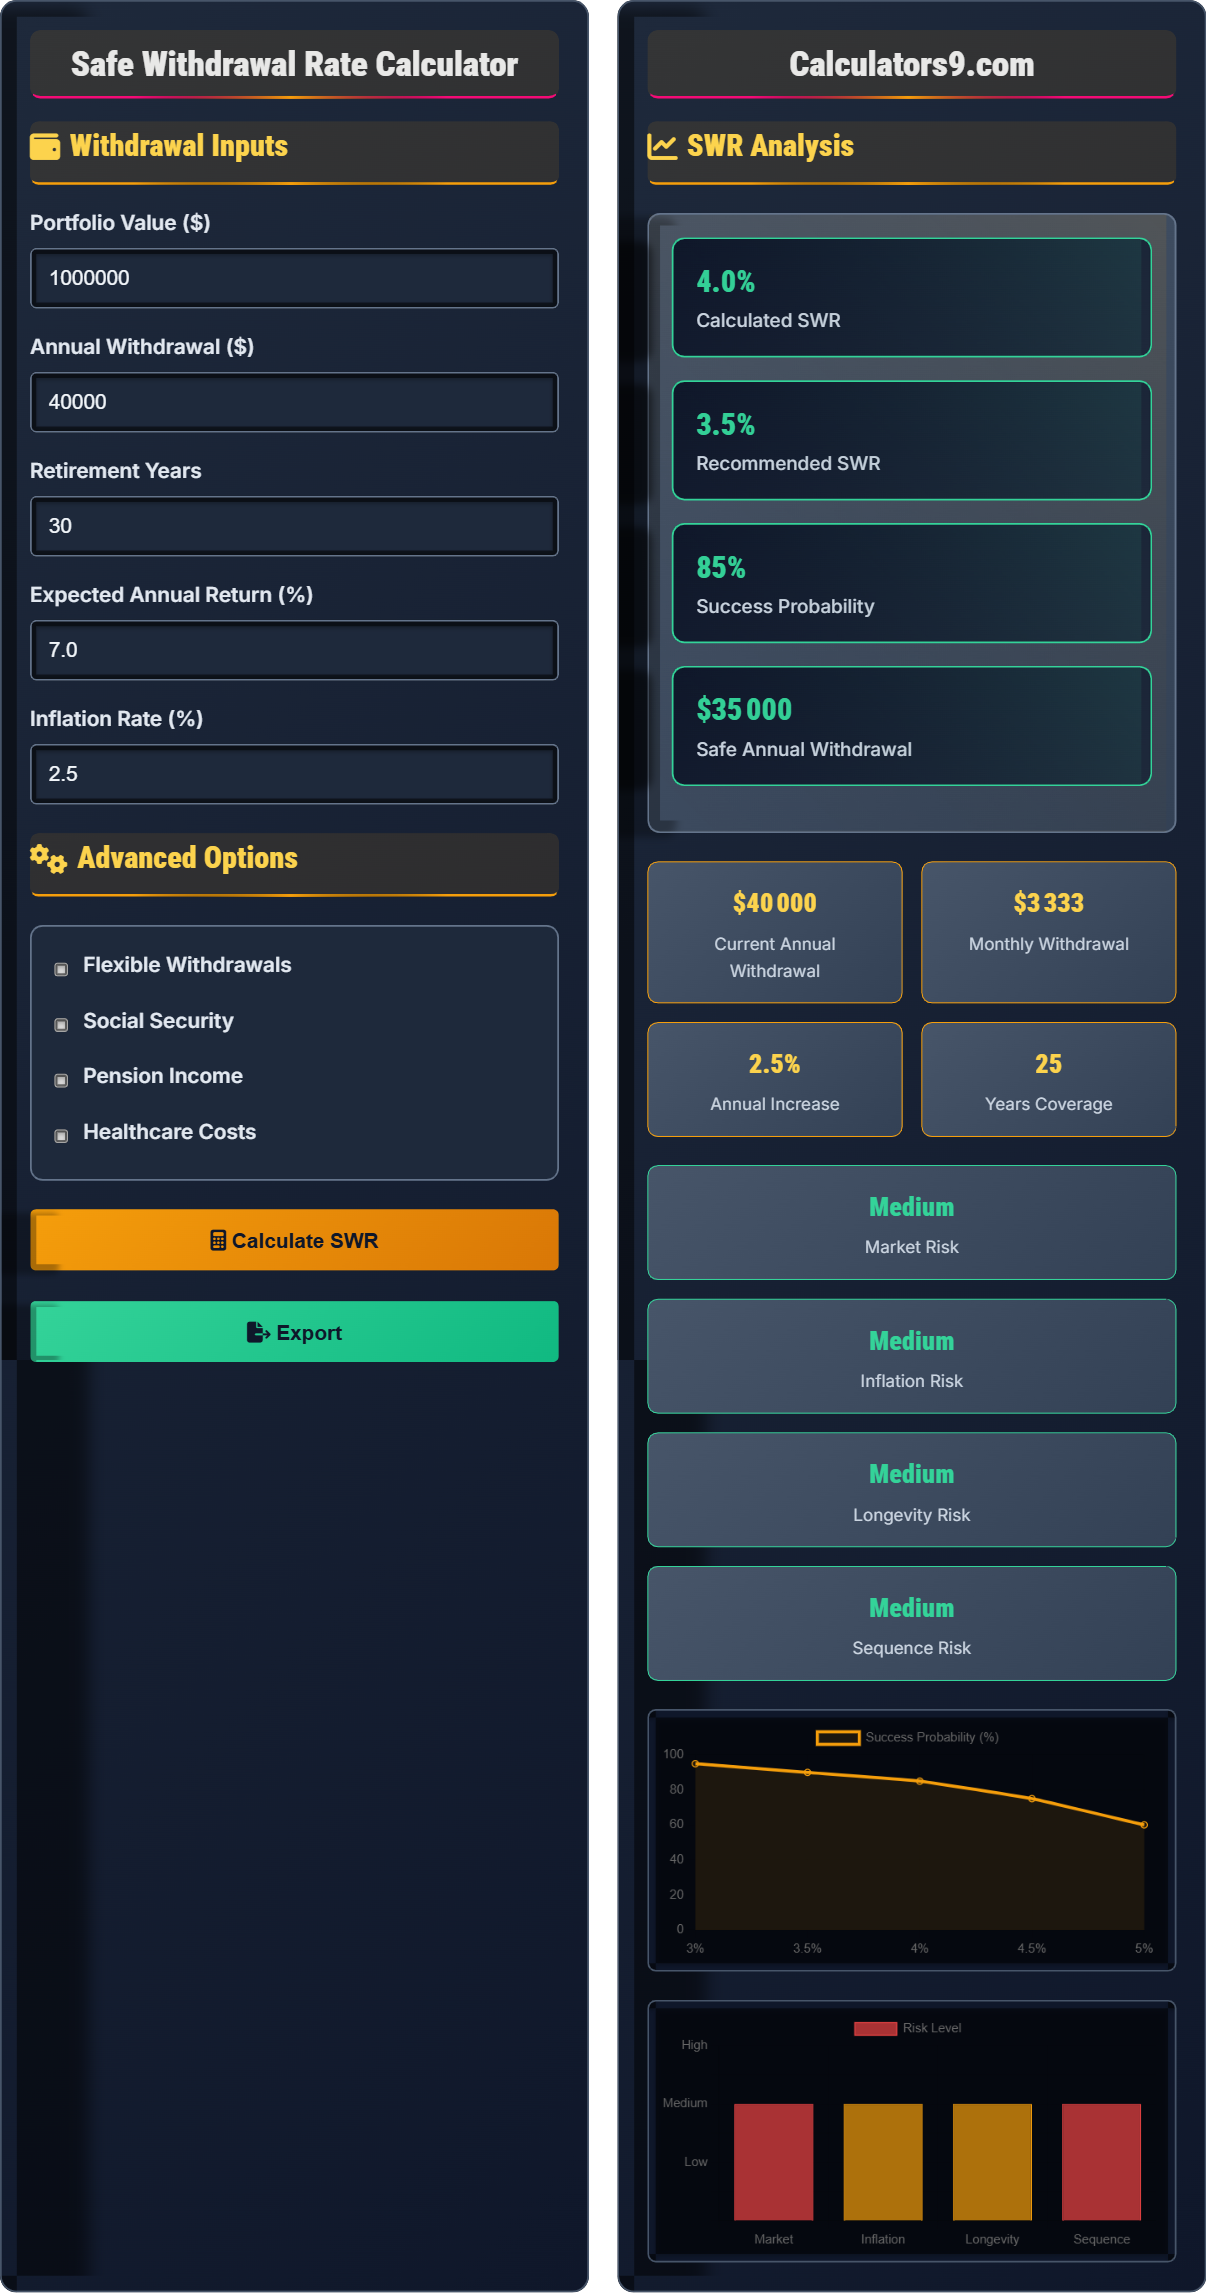
Fast 4% rule calculator • 2026 metrics
Safe Withdrawal Rate Formula:
Show the calculator\( SWR = \frac{Annual\ Withdrawal}{Portfolio\ Value} \times 100 \)
Where:
- \( SWR \) = Safe Withdrawal Rate (%)
- \( Annual\ Withdrawal \) = Annual amount withdrawn from portfolio
- \( Portfolio\ Value \) = Total retirement portfolio value
Alternative formulas:
\( Annual\ Withdrawal = \frac{Portfolio\ Value \times SWR}{100} \)
\( Portfolio\ Value = \frac{Annual\ Withdrawal \times 100}{SWR} \)
This formula calculates the percentage of portfolio that can be safely withdrawn annually without depleting it during retirement.
Example: With a $1,000,000 portfolio and $40,000 annual withdrawal:
\( SWR = \frac{40,000}{1,000,000} \times 100 = 4\% \)
So the withdrawal rate is 4%, which is the traditional "safe" rate according to the Trinity Study.
Withdrawal Inputs
Advanced Options
SWR Analysis
Comprehensive SWR Guide
The Safe Withdrawal Rate (SWR) is the percentage of a retirement portfolio that can be withdrawn annually without depleting the portfolio over a specified retirement period. The famous "4% rule" from the Trinity Study suggests that withdrawing 4% of an initial portfolio value, adjusted for inflation annually, has historically provided a high probability of portfolio survival over 30 years.
The fundamental SWR calculation uses the following formula:
Where:
- \(SWR\) = Safe Withdrawal Rate
- \(Annual\ Withdrawal\) = Annual amount withdrawn
- \(Portfolio\ Value\) = Total portfolio value
Key risks affecting withdrawal sustainability:
- Sequence of Returns Risk: Poor returns early in retirement significantly impact portfolio longevity
- Inflation Risk: Rising prices eroding purchasing power of withdrawals
- Longevity Risk: Outliving your retirement savings
- Market Risk: Volatility and potential bear markets during retirement
- Behavioral Risk: Emotional reactions to market downturns affecting spending decisions
- Asset Allocation: Maintain appropriate stock/bond mix for your risk tolerance
- Flexible Withdrawals: Adjust spending based on market performance
- Diversification: Spread investments across asset classes and geographies
- Delay Social Security: Maximize benefits by claiming at age 70
- Healthcare Planning: Account for rising medical costs in retirement
SWR Basics
Safe withdrawal rate - percentage of portfolio you can withdraw annually.
\( SWR = \frac{Annual\ Withdrawal}{Portfolio\ Value} \times 100 \)
Where SWR=withdrawal rate, Withdrawal=annual amount, Value=portfolio value.
- 4% rule is traditional benchmark
- Adjust for inflation annually
- Consider portfolio volatility
Strategies
Focus on sustainable withdrawal rates with flexibility.
- Start with conservative rate
- Build flexibility into spending
- Monitor portfolio performance
- Adjust based on market conditions
- Retirement length varies
- Market conditions change
- Inflation impacts purchasing power
- Healthcare costs increase
SWR Learning Quiz
What does the traditional "4% rule" suggest about safe withdrawal rates?
The answer is B) Withdraw 4% of initial portfolio value, adjusted for inflation annually, for 30 years. The Trinity Study found that this approach had a high probability of portfolio survival over 30-year periods. The adjustment for inflation is crucial to maintain purchasing power throughout retirement.
The 4% rule is based on historical market data and provides a starting point for retirement planning. The key insight is that the initial withdrawal amount is based on the portfolio value at retirement, and subsequent withdrawals are adjusted for inflation to maintain purchasing power. This approach balances the need for income with the risk of portfolio depletion.
Safe Withdrawal Rate: Sustainable percentage of portfolio to withdraw annually
Trinity Study: Research on sustainable withdrawal rates
Inflation Adjustment: Increasing withdrawals to maintain purchasing power
• Based on initial portfolio value
• Adjust for inflation annually
• Designed for 30-year retirement periods
• Start with 4% as baseline
• Adjust based on market conditions
• Consider shorter retirement periods for more conservative approach
• Not adjusting for inflation
• Using current portfolio value instead of initial value
• Applying to all retirement periods equally
If you have a $800,000 retirement portfolio and want to withdraw $32,000 annually, what is your withdrawal rate? Is this within the traditional safe range?
Using the SWR formula: \( SWR = \frac{Annual\ Withdrawal}{Portfolio\ Value} \times 100 \)
Given:
- Annual Withdrawal = $32,000
- Portfolio Value = $800,000
Step 1: Divide withdrawal by portfolio value = $32,000 ÷ $800,000 = 0.04
Step 2: Multiply by 100 = 0.04 × 100 = 4%
Yes, 4% is exactly at the traditional safe rate according to the 4% rule.
This calculation demonstrates the straightforward nature of SWR calculation. A 4% withdrawal rate is considered the traditional safe rate based on historical data. However, this is a starting point that should be adjusted based on individual circumstances, market conditions, and risk tolerance.
Withdrawal Rate: Annual withdrawal as percentage of portfolio
Safe Range: Historically sustainable withdrawal percentages
Portfolio Sustainability: Ability to maintain withdrawals over time
• Calculate as percentage of portfolio value
• 4% is traditional safe rate
• Adjust based on individual factors
• Use 3-3.5% for more conservative approach
• Consider market valuations when setting rate
• Build flexibility into spending plan
• Forgetting to multiply by 100 to get percentage
• Using wrong portfolio value (current vs. initial)
• Not considering inflation adjustments
You have a $1,200,000 portfolio and plan to withdraw $60,000 annually (5% rate). Your friend has a $600,000 portfolio and plans to withdraw $24,000 annually (4% rate). Who has the higher risk of portfolio depletion, and by how much in percentage terms?
Step 1: Calculate your SWR = ($60,000 ÷ $1,200,000) × 100 = 5%
Step 2: Calculate friend's SWR = ($24,000 ÷ $600,000) × 100 = 4%
Step 3: Your rate is higher than friend's by 5% - 4% = 1 percentage point
Step 4: As percentage of friend's rate = (1 ÷ 4) × 100 = 25% higher
You have a 25% higher withdrawal rate, which significantly increases your risk of portfolio depletion compared to your friend.
This example shows that the withdrawal rate, not the absolute dollar amount, is what matters for portfolio sustainability. Even though you're withdrawing more money in absolute terms, the higher rate relative to portfolio size creates greater risk. The relationship between withdrawal rate and portfolio longevity is not linear—higher rates significantly increase failure risk.
Portfolio Depletion: When portfolio value reaches zero
Relative Risk: Risk compared to another scenario
Withdrawal Rate Impact: Effect of rate on portfolio longevity
• Withdrawal rate is more important than absolute amount
• Higher rates exponentially increase failure risk
• Compare rates, not dollar amounts
• Focus on percentage rates, not dollar amounts
• Higher rates increase risk disproportionately
• Compare your rate to historical safe ranges
• Comparing absolute withdrawal amounts instead of rates
• Not understanding exponential risk relationship
• Ignoring portfolio size in risk assessment
A retiree begins with a $1,000,000 portfolio and withdraws $40,000 annually (4% rule). In the first three years of retirement, they experience returns of -15%, -8%, and +5%. Calculate the portfolio value after three years and explain how this sequence of returns affects long-term sustainability compared to experiencing +5%, -8%, -15% in the first three years.
Scenario 1 (Poor returns early):
Year 1: ($1,000,000 × 0.85) - $40,000 = $850,000 - $40,000 = $810,000
Year 2: ($810,000 × 0.92) - $40,000 = $745,200 - $40,000 = $705,200
Year 3: ($705,200 × 1.05) - $40,000 = $740,460 - $40,000 = $700,460
Scenario 2 (Better returns early):
Year 1: ($1,000,000 × 1.05) - $40,000 = $1,050,000 - $40,000 = $1,010,000
Year 2: ($1,010,000 × 0.92) - $40,000 = $929,200 - $40,000 = $889,200
Year 3: ($889,200 × 0.85) - $40,000 = $755,820 - $40,000 = $715,820
After 3 years: Scenario 1 = $700,460, Scenario 2 = $715,820. Poor early returns result in $15,360 lower portfolio value.
This demonstrates sequence of returns risk—the order of investment returns matters significantly in retirement. Poor returns early in retirement are particularly damaging because: 1) Withdrawals represent a larger percentage of the reduced portfolio, 2) There's less capital to grow in subsequent years, and 3) The portfolio has less time to recover from losses. This is why the 4% rule isn't guaranteed and why flexibility is important.
Sequence of Returns Risk: Impact of return timing on portfolio longevity
Portfolio Depletion: When portfolio value reaches zero
Early Retirement Losses: Particularly damaging to portfolio sustainability
• Early poor returns are most damaging
• Withdrawals from smaller base are proportionally larger
• Recovery time is limited in early retirement
• Maintain flexibility to reduce withdrawals after market losses
• Consider bucket strategy for first few years
• Plan for temporary spending reductions
• Ignoring sequence of returns risk
• Maintaining fixed withdrawals after market decline
• Not planning for flexibility in spending
Recent research suggests that the traditional 4% rule may be too aggressive in today's environment due to which factor?
The answer is B) Lower expected future returns and higher valuations. Modern research, including studies by Bengen and others, suggests that with current high market valuations and lower expected bond yields, future returns may be lower than historical averages. This means the traditional 4% rule may have a higher probability of failure in current market conditions.
The 4% rule was based on historical data from the 20th century when bond yields were higher and market valuations were lower. Today's environment of lower expected returns means that portfolios may not grow as fast, making higher withdrawal rates riskier. Many financial planners now recommend starting with 3-3.5% for more conservative planning, especially in high valuation environments.
Market Valuations: Current price levels relative to fundamentals
Expected Returns: Anticipated future investment returnsForward-Looking Analysis: Considering current conditions in planning
• Historical rules may not apply to current conditions
• Lower expected returns require lower SWRs
• Adjust for current market environment
• Consider current market valuations
• Use lower rates in high valuation environments
• Build flexibility into retirement plan
• Applying historical rules without context
• Ignoring current market conditions
• Not adjusting for changing expected returns
FAQ
Q: Should I adjust my withdrawal rate if the market crashes?
A: Yes, many financial planners recommend temporary withdrawal rate adjustments after significant market downturns:
- Reduce withdrawals: Temporarily lower spending by 10-20% for 2-3 years
- Switch to cash: Use emergency reserves instead of selling assets at low prices
- Flexible approach: Consider percentage-of-portfolio withdrawals
Research shows that maintaining fixed withdrawals after major market drops significantly increases the risk of portfolio depletion. The sequence of returns risk is most dangerous when poor returns occur early in retirement.
Q: How do I account for inflation in my withdrawal strategy?
A: Inflation adjustment is crucial for maintaining purchasing power:
- Annual increases: Increase withdrawals by inflation rate each year
- Modified approach: Cap increases during market downturns
- Hybrid strategy: Combine fixed increases with market performance
Example: If inflation is 3% and your withdrawal is $40,000, next year's withdrawal would be $40,000 × 1.03 = $41,200. However, some planners recommend skipping inflation adjustments in years when the portfolio has declined significantly.