BMI Calculator
Body mass index • health assessment
BMI Formula:
Show the calculator\( BMI = \frac{weight\ (kg)}{height^2\ (m^2)} \)
Or in imperial units:
\( BMI = \frac{weight\ (lbs) \times 703}{height^2\ (in^2)} \)
Where:
- \( BMI \) = Body Mass Index
- \( weight \) = Body weight in kilograms or pounds
- \( height \) = Height in meters or inches
BMI categories according to WHO standards:
- Underweight: BMI < 18.5
- Normal weight: BMI 18.5-24.9
- Overweight: BMI 25.0-29.9
- Obesity Class I: BMI 30.0-34.9
- Obesity Class II: BMI 35.0-39.9
- Obesity Class III: BMI ≥ 40.0
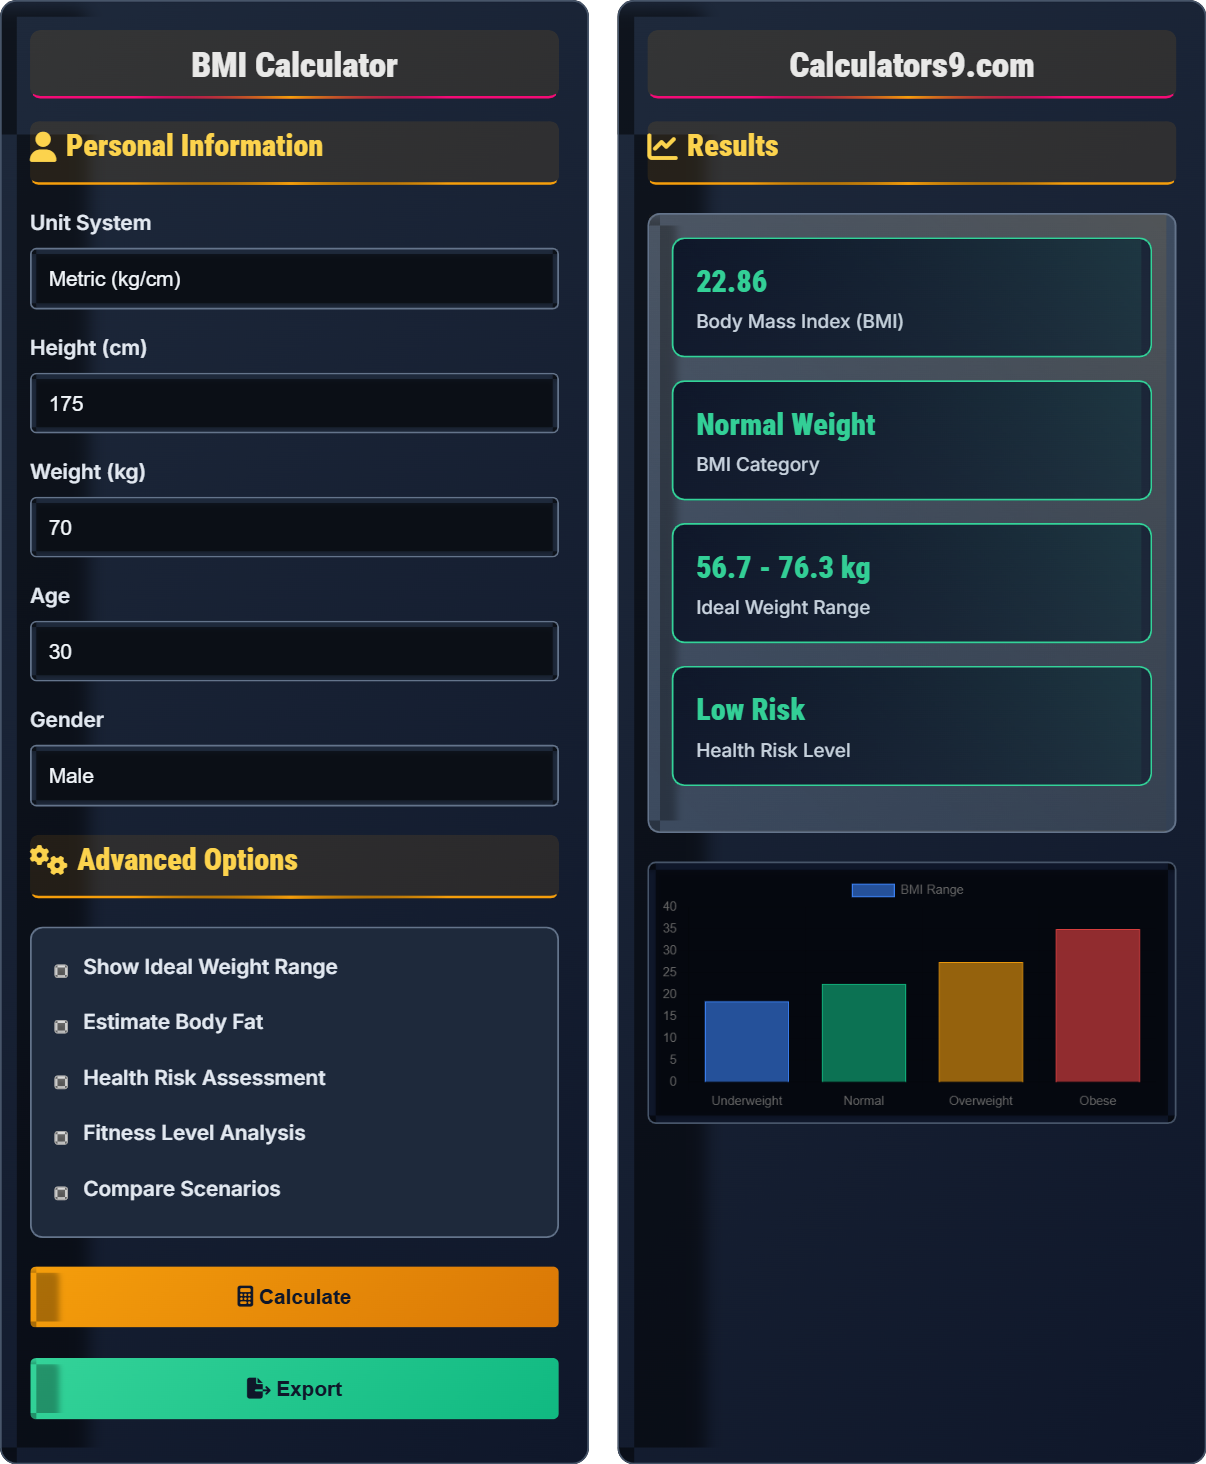
Example: For a person weighing 70 kg and 1.75 m tall:
\( BMI = \frac{70}{1.75^2} = \frac{70}{3.0625} = 22.86 \)
This BMI of 22.86 falls within the normal weight range.
Personal Information
Advanced Options
Results
| Category | BMI Range | Health Risk | Your Status |
|---|
| Goal | Weight (kg) | Weight (lbs) | Difference |
|---|
Comprehensive BMI Guide
Body Mass Index (BMI) is a measure of body fat based on height and weight that applies to adult men and women. Developed by Belgian mathematician Adolphe Quetelet in the 1830s, BMI provides a simple numeric measure of a person's thickness or thinness. While not a direct measure of body fat, BMI correlates with direct measures of body fat and is widely used as a screening tool for weight categories that may lead to health problems.
The standard BMI formula is:
Or in imperial units:
Where:
- \(BMI\) = Body Mass Index
- \(weight\) = Body weight in kilograms or pounds
- \(height\) = Height in meters or inches
Higher BMI categories are associated with increased risks of various health conditions:
- Cardiovascular Disease: Heart disease, stroke, hypertension
- Metabolic Disorders: Type 2 diabetes, metabolic syndrome
- Respiratory Issues: Sleep apnea, breathing difficulties
- Musculoskeletal Problems: Osteoarthritis, joint pain
- Cancer Risk: Certain cancers linked to excess weight
- Athletes: May have high BMI due to muscle mass, not fat
- Elderly: Muscle mass decreases with age, affecting BMI interpretation
- Ethnicity: Some populations have different health risks at similar BMIs
- Body Composition: Doesn't distinguish between fat and muscle
- Distribution: Doesn't account for fat distribution (visceral vs subcutaneous)
BMI Basics
Numeric measure of body fat based on height and weight.
\(BMI = \frac{weight\ (kg)}{height^2\ (m^2)}\)
Or \(BMI = \frac{weight\ (lbs) \times 703}{height^2\ (in^2)}\)
- Normal range: 18.5-24.9
- Overweight: 25.0-29.9
- Obesity: ≥30.0
Health Implications
Classifications help assess health risks and treatment needs.
- Balanced diet with appropriate calories
- Regular physical activity
- Monitor weight changes
- Consult healthcare provider
- Doesn't account for muscle vs fat
- Ethnic differences in health risks
- Age-related changes in body composition
- Waist circumference matters too
BMI Learning Quiz
According to WHO standards, what BMI range is classified as "Overweight"?
The answer is B) 25.0-29.9. According to the World Health Organization (WHO) standards, a BMI of 25.0-29.9 is classified as overweight. This category indicates an increased risk of developing health problems compared to the normal weight range (18.5-24.9).
Understanding BMI categories is crucial for interpreting health assessments. The WHO classification system provides standardized ranges that help healthcare providers and individuals assess health risks associated with different weight categories. The progression from underweight to obesity represents increasing health risks.
BMI: Body Mass Index - measure of body fat based on height and weight
WHO: World Health Organization - sets international health standards
Health Risk: Likelihood of developing weight-related health problems
• Normal weight: BMI 18.5-24.9
• Overweight: BMI 25.0-29.9
• Obesity: BMI ≥ 30.0
• Remember: 18.5-24.9 = Normal
• Overweight starts at 25.0
• Obesity starts at 30.0
• Confusing the boundaries between categories
• Thinking BMI is the only measure of health
• Not considering BMI limitations
Calculate the BMI for a person who is 1.70 meters tall and weighs 75 kg. Show your work.
Using the BMI formula: \(BMI = \frac{weight\ (kg)}{height^2\ (m^2)}\)
Given:
- Weight = 75 kg
- Height = 1.70 m
Step 1: Calculate height squared = 1.70² = 2.89 m²
Step 2: Calculate BMI = 75 ÷ 2.89 = 25.95
Therefore, the BMI is 25.95, which falls in the "Overweight" category (25.0-29.9).
This calculation demonstrates the straightforward nature of BMI computation. The formula simply divides weight by the square of height. The resulting number is then compared to standard categories to determine weight status. This example shows someone who is slightly overweight according to WHO standards.
Body Mass Index: Measure of body fat based on height and weight
Metric System: Uses kilograms and meters for measurements
Weight Status: Classification based on BMI value
• Square the height measurement
• Use consistent units (kg and m)
• Compare result to standard categories
• Remember to square the height
• Use metric units for standard calculations
• Verify your math carefully
• Forgetting to square the height
• Mixing metric and imperial units
• Incorrectly identifying BMI category
Sarah is 1.65 meters tall. What is her ideal weight range based on the healthy BMI range of 18.5-24.9? Calculate both the minimum and maximum healthy weights.
Step 1: Calculate minimum healthy weight (BMI = 18.5)
Minimum weight = BMI × height² = 18.5 × (1.65)² = 18.5 × 2.7225 = 50.37 kg
Step 2: Calculate maximum healthy weight (BMI = 24.9)
Maximum weight = BMI × height² = 24.9 × (1.65)² = 24.9 × 2.7225 = 67.79 kg
Step 3: Therefore, Sarah's ideal weight range is approximately 50.4 kg to 67.8 kg.
For practical purposes, this would be 50-68 kg.
This problem demonstrates how BMI can be used in reverse to determine ideal weight ranges. By rearranging the BMI formula (weight = BMI × height²), we can calculate the weight that corresponds to specific BMI values. This is useful for setting realistic weight goals.
Ideal Weight Range: Weight range corresponding to healthy BMI values
Healthy BMI: Range of 18.5-24.9 considered lowest health risk
Weight Goal: Target weight based on health considerations
• Minimum healthy weight = 18.5 × height²
• Maximum healthy weight = 24.9 × height²
• Ideal range = 18.5-24.9 BMI
• Rearrange BMI formula to find weight
• Calculate both ends of the range
• Round to reasonable values
• Forgetting to square the height in reverse calculation
• Using incorrect BMI values for healthy range
• Not calculating both minimum and maximum values
Mike is a professional athlete who is 1.85 meters tall and weighs 95 kg. His BMI is 27.8. How should this BMI be interpreted considering his athletic status? What other measurements might be important?
Step 1: Calculate Mike's BMI = 95 ÷ (1.85)² = 95 ÷ 3.4225 = 27.8
Step 2: Standard interpretation: BMI 27.8 falls in the "Overweight" category (25.0-29.9)
Step 3: Athletic consideration: Athletes often have higher muscle mass, which increases weight but not necessarily health risks
Step 4: Other important measurements include:
- Body fat percentage
- Waist circumference
- Muscle mass percentage
- Waist-to-hip ratio
Step 5: Therefore, while Mike's BMI suggests overweight, his athletic status likely means he has a healthy body composition with high muscle mass.
This example highlights an important limitation of BMI: it doesn't distinguish between muscle and fat. Athletes and very muscular individuals often have higher BMIs despite having low body fat percentages. This is why BMI should be interpreted alongside other body composition measurements.
Body Composition: Proportion of fat, muscle, bone, and other tissues
Muscle Mass: Amount of skeletal muscle tissue in the body
Limitation: Aspect of BMI that reduces its accuracy for certain populations
• BMI doesn't differentiate muscle from fat
• Athletes may have high BMI with low body fat
• Use additional measures for complete assessment
• Consider muscle mass when interpreting BMI
• Use multiple measures for body composition
• Consult professionals for complex cases
• Taking BMI as definitive without considering context
• Not accounting for muscle mass in athletes
• Relying solely on BMI for health assessment
Which of the following health risks is most strongly associated with a BMI in the "Obesity Class II" category (BMI 35.0-39.9)?
The answer is B) Type 2 Diabetes. Obesity Class II (BMI 35.0-39.9) significantly increases the risk of developing Type 2 diabetes due to insulin resistance caused by excess body fat. The risk of diabetes increases progressively with higher BMI categories, with Class II obesity carrying a substantially elevated risk compared to normal weight individuals.
The relationship between BMI and health risks is well-established through extensive research. Obesity Class II represents severe overweight that significantly impacts metabolic health. The accumulation of visceral fat in this category contributes to insulin resistance, inflammation, and other metabolic disturbances that lead to diabetes development.
Type 2 Diabetes: Metabolic disorder characterized by insulin resistance
Insulin Resistance: Condition where cells don't respond properly to insulinVisceral Fat: Abdominal fat surrounding organs
• Health risks increase with higher BMI categories
• Obesity Class II has severe health implications
• Type 2 diabetes risk is significantly elevated
• Remember: Higher BMI = Higher health risks
• Diabetes is strongly linked to obesity
• Visceral fat is particularly problematic
• Underestimating health risks at higher BMI levels
• Not recognizing the connection between obesity and diabetes
• Thinking all health risks are equally affected by BMI
FAQ
Q: My BMI is 28.5 but I'm physically fit with low body fat. Is BMI accurate for me?
A: BMI has known limitations for muscular individuals. Since BMI only considers weight and height without distinguishing between muscle and fat, athletes and very muscular people often have higher BMIs despite having healthy body compositions.
The mathematical basis of BMI is: \(BMI = \frac{weight\ (kg)}{height^2\ (m^2)}\). This formula doesn't account for the density difference between muscle and fat. Muscle is denser than fat, so a muscular person may weigh more but have a lower body fat percentage.
For someone like you, additional measures are recommended:
- Body fat percentage measurement
- Waist circumference
- Waist-to-hip ratio
- Physical fitness assessments
Your BMI of 28.5 categorizes as "Overweight," but given your fitness level, you likely have a healthy body composition.
Q: How much does BMI correlate with actual body fat percentage?
A: Studies show BMI correlates with body fat percentage at approximately r=0.7-0.8 in general populations, indicating a strong positive correlation. However, this correlation varies significantly based on demographic factors.
The relationship follows the basic BMI formula: \(BMI = \frac{weight\ (kg)}{height^2\ (m^2)}\), where weight includes both fat and lean mass. Research indicates:
- General population: ~70-80% correlation with body fat
- Athletes: Much lower correlation due to muscle mass
- Elderly: Different relationship due to muscle loss
- Gender differences: Women typically have higher body fat at same BMI
For more precise body fat assessment, methods like DEXA scans, bioelectrical impedance, or skinfold measurements are more accurate than BMI alone.