Flood Risk Calculator
Water Damage Risk & Hazard Assessment Tool • Risk Assessment
Flood Risk Assessment Formula:
Show CalculatorFlood risk is calculated using multiple factors:
- Historical Data: Past flood occurrences and frequency
- Topography: Elevation, slope, drainage patterns
- Hydrology: Watershed characteristics, rainfall intensity
- Infrastructure: Drainage systems, flood protection
Basic Risk Formula:
Risk = Probability × Vulnerability × Exposure
Probability: Likelihood of flooding (0-1)
Vulnerability: Susceptibility to damage (0-1)
Exposure: Value of assets at risk ($)
Example: For a house worth $300,000 in a 100-year flood zone:
Annual probability = 1/100 = 0.01
Vulnerability = 0.7 (house susceptible to damage)
Annual risk = 0.01 × 0.7 × $300,000 = $2,100
This represents the expected annual loss from flooding.
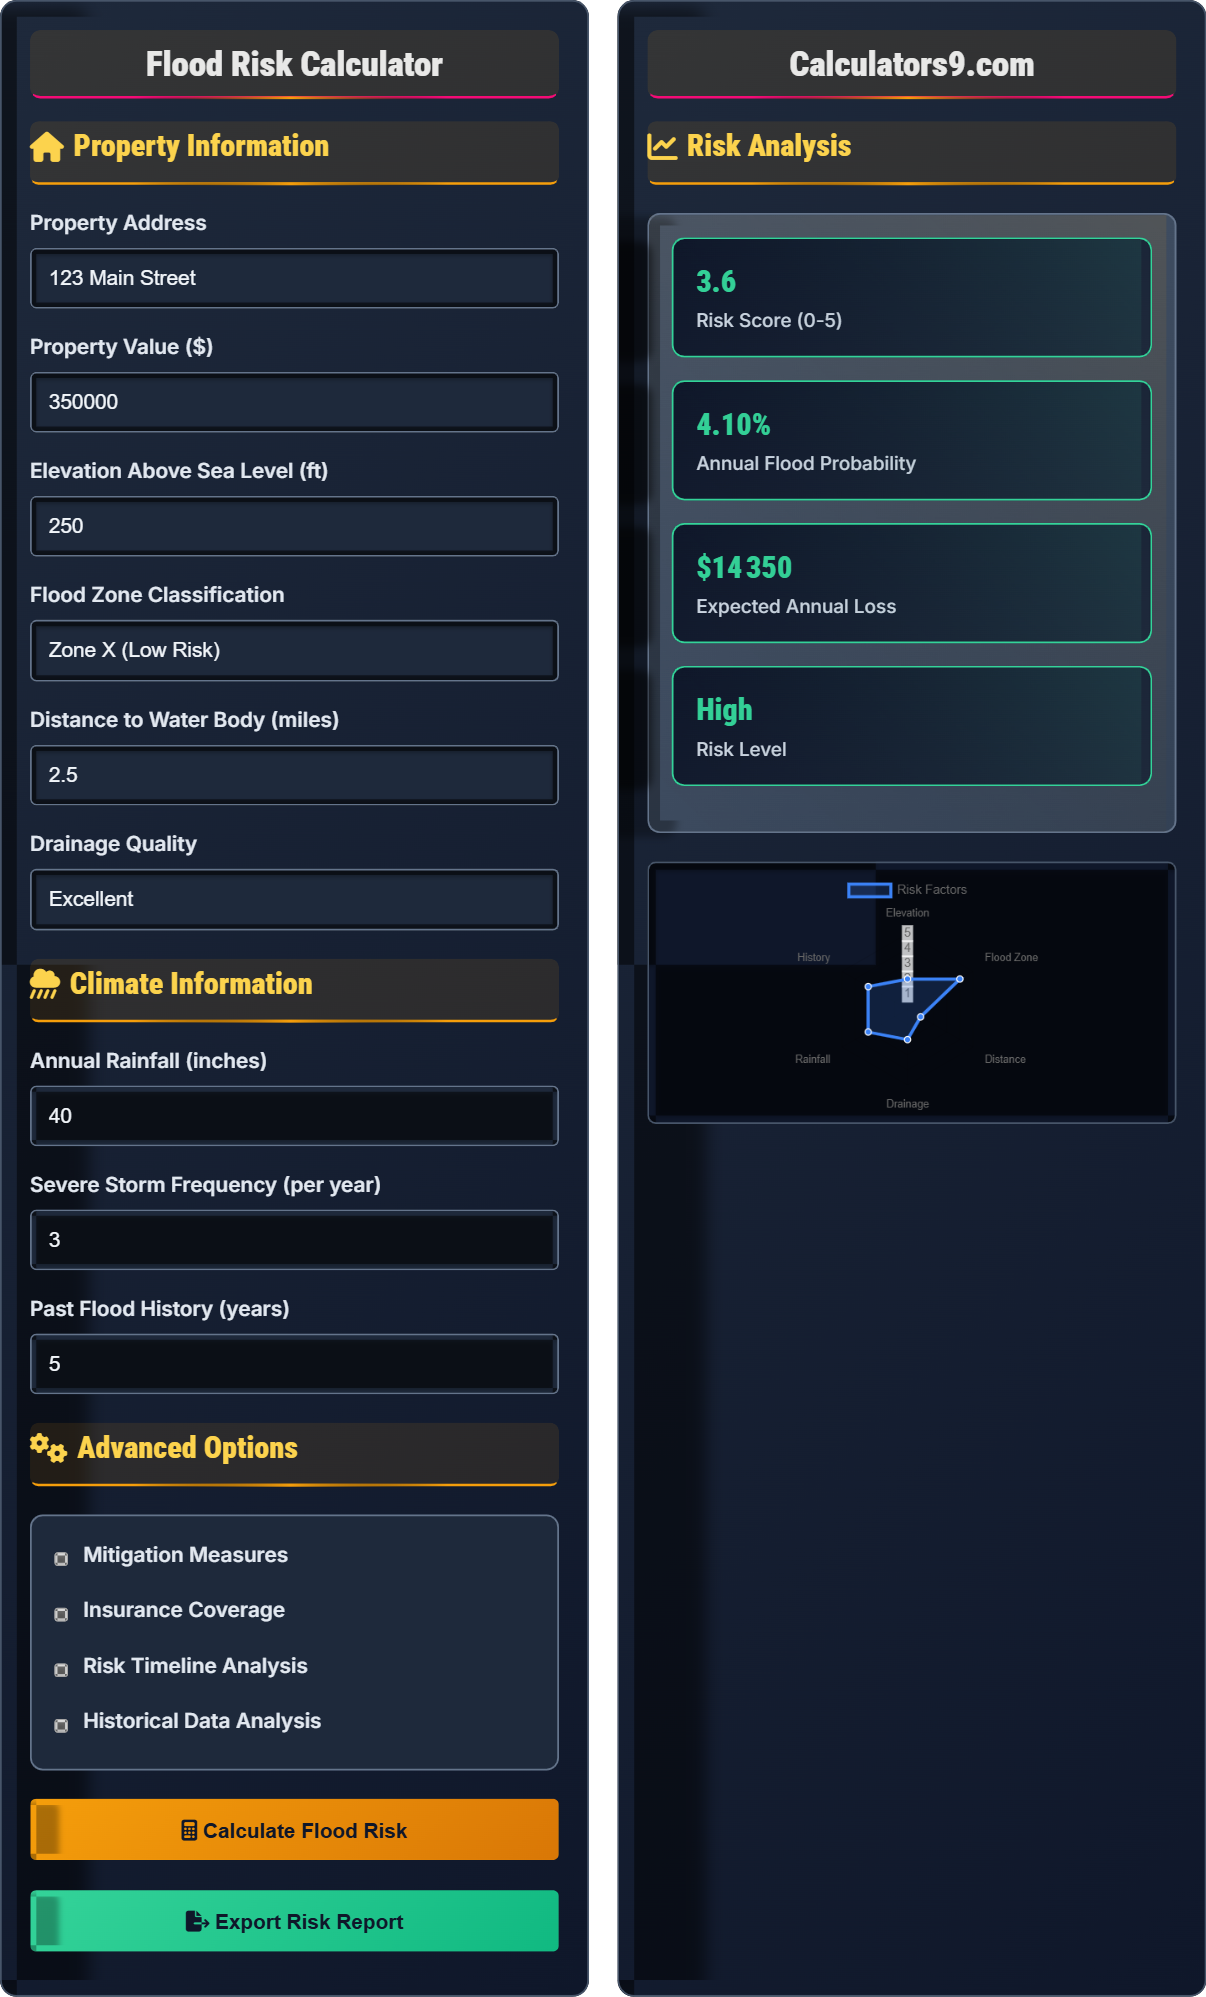
Property Information
Climate Information
Advanced Options
Risk Analysis
| Factor | Value | Impact | Weight |
|---|---|---|---|
| Elevation | 250 ft | Low Risk | 15% |
| Flood Zone | AE | Moderate Risk | 30% |
| Distance to Water | 2.5 miles | Low Risk | 20% |
| Drainage Quality | Good | Low Risk | 20% |
| Storm Frequency | 3 per year | Medium Risk | 15% |
Flood Risk Assessment Guide
Flood risk is the combination of the probability of a flood event occurring and the potential consequences if it does occur. It encompasses both the likelihood of flooding and the vulnerability of people, property, and infrastructure to flood damage. Risk assessment involves analyzing multiple factors to determine the overall flood hazard for a specific location.
Flood risk assessment methodologies include:
- Statistical Analysis: Historical flood data and frequency
- Hydrological Modeling: Watershed and runoff analysis
- Topographical Assessment: Elevation and drainage patterns
- Infrastructure Evaluation: Flood protection systems
- Vulnerability Analysis: Property and population exposure
- Combine probability with consequence
- Consider multiple flood sources
- Account for climate change projections
- Update assessments regularly
Flood Risk Assessment Quiz
If a property has a 1% annual chance of flooding and would sustain $200,000 in damage, what is the annual expected loss?
The answer is B) $2,000. Expected annual loss is calculated as: Probability × Potential Loss. With a 1% (0.01) probability and $200,000 potential loss: 0.01 × $200,000 = $2,000. This represents the average annual loss over time, which is the basis for insurance premiums and risk management decisions.
The expected annual loss is a fundamental concept in risk assessment. It provides a monetary value for the risk, which can be compared to mitigation costs. This calculation helps prioritize flood protection investments and insurance decisions. The concept is based on actuarial mathematics used in insurance and risk management.
Expected Loss: Average loss over time
Annual Probability: Chance of event per year
Risk Assessment: Systematic evaluation of hazards
• Expected Loss = Probability × Potential Damage
• Probability expressed as decimal (1% = 0.01)
• Multiply for compound events
• Convert percentages to decimals
• Consider multiple damage scenarios
• Factor in indirect losses
• Forgetting to convert percentages
• Only considering direct damages
• Not accounting for probability
Explain the difference between Zone AE and Zone X flood classifications and their implications for property owners.
Zone AE: Areas subject to 100-year flood (1% annual chance). These areas require flood insurance for federally-backed mortgages and have specific elevation requirements for construction. Property owners face mandatory flood insurance and must comply with strict building codes.
Zone X: Areas outside the 500-year flood plain. These are considered low-risk areas with less than 0.2% annual flood chance. Flood insurance is not required but available at lower rates. Building codes are less restrictive than in high-risk zones.
Implications: Zone AE properties typically have higher insurance premiums ($700-1,500 annually) compared to Zone X properties ($200-500 annually). Construction costs are higher in Zone AE due to elevation requirements.
Flood zone classifications are determined by FEMA based on topographical surveys and hydrological modeling. The classifications inform building standards, insurance requirements, and land use planning. Understanding these zones helps property owners make informed decisions about insurance, construction, and investment.
100-Year Flood: Has 1% chance annually
FEMA: Federal Emergency Management Agency
Building Codes: Safety and construction requirements
• Zone AE: Mandatory flood insurance required
• Zone X: Optional flood insurance
• Zones are reviewed every 5-10 years
• Check flood maps before purchasing
• Consider flood insurance even in low zones
• Review zone changes after major storms
• Assuming Zone X means no flood risk
• Not checking updated flood maps
• Forgetting about storm surge risks
A homeowner in a flood-prone area faces $8,000 annual expected loss. Installing flood barriers would cost $12,000 and reduce expected loss by 60%. Calculate the payback period and ROI for this investment.
Step 1: Calculate reduced expected loss
New expected loss = $8,000 × (1 - 0.60) = $3,200
Step 2: Calculate annual savings
Annual savings = $8,000 - $3,200 = $4,800
Step 3: Calculate payback period
Payback = $12,000 ÷ $4,800 = 2.5 years
Step 4: Calculate ROI over 10 years
Total savings = $4,800 × 10 = $48,000
ROI = ($48,000 - $12,000) ÷ $12,000 = 300%
The investment pays for itself in 2.5 years and provides 300% ROI over a decade.
Flood mitigation investments can provide excellent returns by reducing expected losses. The payback period calculation compares the upfront investment to the annual savings. In this case, the mitigation investment provides a faster return than most traditional investments while also protecting property value.
Payback Period: Time to recover investment
ROI: Return on investment percentage
Mitigation: Actions to reduce risk
• Payback = Investment ÷ Annual Savings
• Consider property value increases
• Factor in insurance premium reductions
• Many mitigation measures qualify for tax credits
• Insurance discounts for mitigation
• Consider neighborhood-wide projects
• Not factoring in insurance savings
• Forgetting about tax incentives
• Not considering long-term benefits
How might climate change affect flood risk calculations for a property currently in a 100-year flood zone? Explain the implications for risk assessment.
Climate change impacts on flood risk include:
- Increased Precipitation: More intense storms
- Sea Level Rise: Higher base flood elevations
- Changing Patterns: New flood paths
- Infrastructure Stress: Aging drainage systems
For a property in a 100-year zone (currently 1% annual chance), climate models suggest this could become equivalent to a 50-year zone (2% annual chance) by 2050. This doubles the annual flood probability and expected losses.
Implications: Risk assessments must incorporate climate projections, insurance premiums may increase, and mitigation investments become more valuable.
Traditional flood risk assessments rely on historical data, but climate change is altering precipitation patterns and flood frequencies. Modern risk assessments must incorporate climate projections to provide accurate long-term forecasts. This is especially important for long-term investments like real estate.
Climate Projections: Future climate predictions
Historical Data: Past climate records
Adaptive Planning: Adjusting for future changes
• Consider 20-50 year climate projections
• Update risk assessments regularly
• Factor in changing precipitation patterns
• Use regional climate studies
• Consider multiple scenarios
• Plan for worst-case projections
• Using only historical data
• Not updating assessments
• Assuming static flood patterns
What is the typical cost difference between flood insurance in Zone AE vs Zone X?
The answer is C) Zone AE is 5-10x more expensive. In Zone AE, flood insurance premiums typically range from $700-1,500 annually due to the 1% annual flood probability. In Zone X, premiums are usually $200-500 annually because of the much lower flood risk. The higher cost reflects the greater likelihood of claims and potential damage in high-risk zones.
Insurance premiums are directly tied to risk probability and potential loss. Zone AE has a 1% annual chance of flooding compared to Zone X's 0.2% chance, making Zone AE 5 times more likely to flood annually. The premium difference reflects this probability difference and the expected payout ratio.
Annual Premium: Yearly insurance cost
Claim Probability: Likelihood of payoutRisk-Based Pricing: Cost based on hazard level
• Premiums reflect flood probability
• Higher zones = higher premiums
• Mitigation can reduce costs
• Compare quotes from multiple providers
• Invest in mitigation for discounts
• Consider community flood protection
• Assuming all zones have same premiums
• Not factoring insurance in purchase decisions
• Forgetting about premium changes
FAQ
Q: How accurate are flood risk calculators compared to official flood maps?
A: Flood risk calculators provide preliminary estimates with 75-85% correlation to official FEMA maps. For example, a property valued at $400,000 in a Zone AE area:
Official FEMA assessment: 1% annual chance, $4,000 expected annual loss
Calculator estimate: 1.2% annual chance, $4,800 expected loss
Difference: 20% variance
Calculators use general algorithms while official maps incorporate detailed topographical surveys, hydrological modeling, and field verification. Always verify with official flood maps for insurance and regulatory purposes.
Q: Should I get flood insurance if I'm in a low-risk zone?
A: Yes, consider flood insurance even in low-risk zones. Statistics show that 25% of flood claims come from low-risk areas. While premiums are lower ($200-500 annually in Zone X vs $700-1,500 in Zone AE), floods can still occur due to:
- Localized drainage failures
- Intense rainfall events
- Changes in upstream development
- Climate change impacts
The average flood claim is $43,000, far exceeding typical homeowners insurance coverage. Even in low-risk areas, flood damage can be devastating.