GDP Calculator
Accurate GDP analysis • 2026 standards
GDP Components
Advanced Options
GDP Results
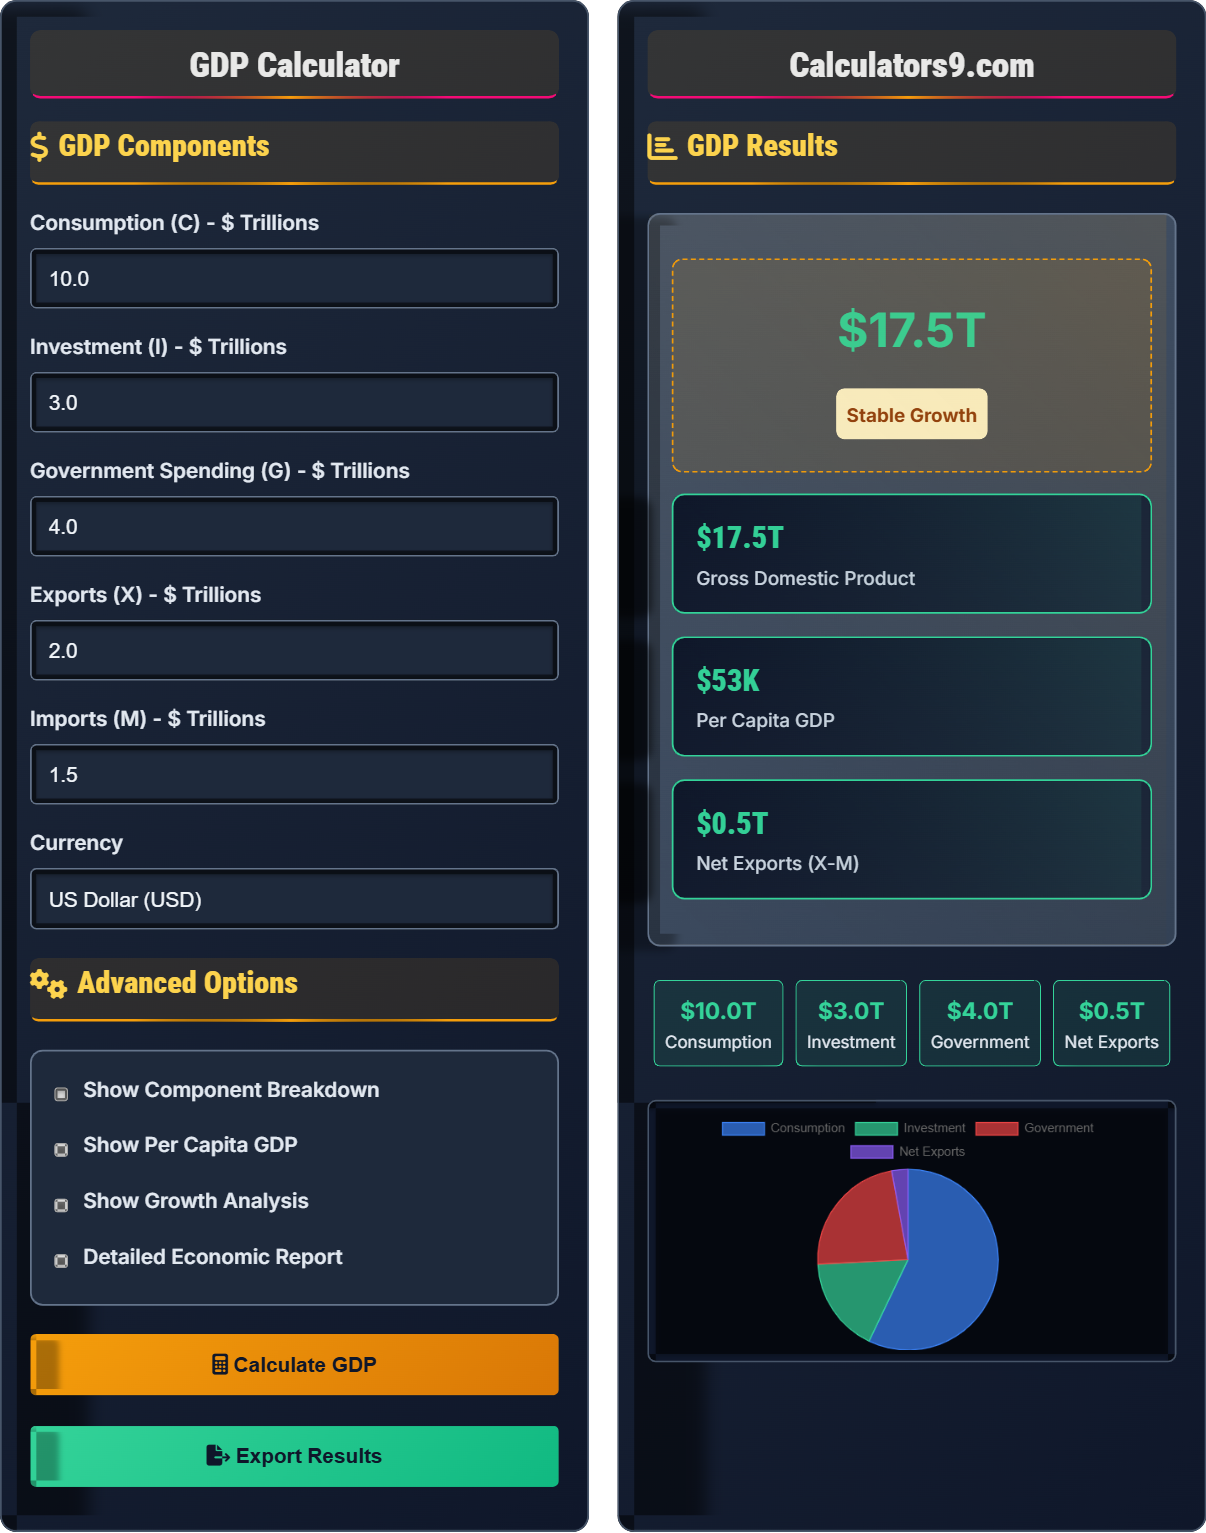
| Component | Value | Percentage |
|---|---|---|
| Consumption (C) | $10.0T | 57.1% |
| Investment (I) | $3.0T | 17.1% |
| Government (G) | $4.0T | 22.9% |
| Net Exports (X-M) | $0.5T | 2.9% |
| Indicator | Value | Interpretation |
|---|---|---|
| GDP Growth Rate | 2.3% | Healthy expansion |
| Consumption Share | 57.1% | Consumer-driven economy |
| Investment Share | 17.1% | Healthy investment level |
| Trade Balance | +$0.5T | Trade surplus |
GDP Analysis Guide
Gross Domestic Product (GDP) is the total monetary value of all finished goods and services produced within a country's borders in a specific time period. It serves as a comprehensive measure of a nation's economic activity and is the most commonly used indicator of economic health. GDP includes all private and public consumption, government outlays, investments, additions to private inventories, paid-in construction costs, and the foreign balance of trade.
The expenditure approach to calculating GDP is:
Where:
- \(C\) = Consumer spending on goods and services
- \(I\) = Investment in capital equipment, inventories, and structures
- \(G\) = Government spending on goods and services
- \(X\) = Exports of goods and services
- \(M\) = Imports of goods and services
GDP is used to measure economic growth, standard of living, and economic performance:
- GDP Growth Rate: Percentage change in GDP over time
- Per Capita GDP: GDP divided by population
- Real GDP: GDP adjusted for inflation
- Purchasing Power Parity: GDP adjusted for price differences between countries
- Policy Making: Governments use GDP to formulate economic policies
- Investment Decisions: Businesses use GDP data for strategic planning
- International Comparisons: Comparing economic performance across countries
- Standard of Living: Measuring economic well-being of populations
- Academic Research: Studying economic trends and relationships
GDP Learning Quiz
What does GDP measure?
The answer is B) The total value of all goods and services produced in a country. GDP measures the total monetary value of all finished goods and services produced within a country's borders in a specific time period, serving as the most comprehensive measure of economic activity.
GDP is a fundamental concept in macroeconomics that provides insight into the size and health of an economy. It captures production across all sectors including consumer goods, business investment, government services, and international trade. Understanding GDP helps analyze economic performance and make informed decisions.
GDP: Gross Domestic Product, total value of goods/services produced in a country
Economic Activity: Production, consumption, and exchange of goods and services
Finished Goods: Products ready for consumption or use
• GDP measures production within geographic boundaries
• Includes all private and public consumption
• Counts only finished goods to avoid double counting
• Remember: GDP measures production, not income
• Only finished goods count in GDP
• GDP = Consumption + Investment + Government + Net Exports
• Confusing GDP with Gross National Product (GNP)
• Including intermediate goods in GDP calculation
• Not accounting for inflation when comparing GDP over time
Calculate GDP using the expenditure approach if: Consumption = $12 trillion, Investment = $3.5 trillion, Government spending = $4.2 trillion, Exports = $2.8 trillion, and Imports = $3.1 trillion. Show your work.
Step 1: Identify components
C = $12T, I = $3.5T, G = $4.2T, X = $2.8T, M = $3.1T
Step 2: Apply the formula: GDP = C + I + G + (X - M)
Step 3: Calculate net exports: X - M = $2.8T - $3.1T = -$0.3T
Step 4: Calculate GDP: GDP = $12T + $3.5T + $4.2T + (-$0.3T) = $19.4T
Therefore, GDP = $19.4 trillion
This problem demonstrates the importance of correctly handling net exports in GDP calculations. Note that imports are subtracted from exports, so when imports exceed exports (trade deficit), net exports is negative, reducing GDP. The calculation shows how all components contribute to the total economic output.
Net Exports: Exports minus imports (X-M)
Trade Deficit: When imports exceed exports (negative net exports)
Trade Surplus: When exports exceed imports (positive net exports)
• Net exports can be positive or negative
• Imports are subtracted from GDP
• Only finished goods count in GDP
• Remember: GDP = C + I + G + NX
• NX = Exports - Imports
• Negative net exports reduce GDP
• Adding imports instead of subtracting them
• Forgetting to calculate net exports (X-M)
• Including intermediate goods in GDP
An economy has the following components: Consumer spending of $8 trillion, business investment of $2.5 trillion, government expenditures of $3.2 trillion, exports of $1.8 trillion, and imports of $2.1 trillion. Calculate the GDP and analyze the economic structure. What percentage of GDP is represented by consumer spending?
Step 1: Calculate GDP using the expenditure approach
GDP = C + I + G + (X - M)
GDP = $8T + $2.5T + $3.2T + ($1.8T - $2.1T)
GDP = $8T + $2.5T + $3.2T + (-$0.3T)
GDP = $13.4T
Step 2: Calculate consumer spending percentage
Percentage = (Consumer Spending / GDP) × 100
Percentage = ($8T / $13.4T) × 100 = 59.7%
The economy is consumer-driven with 59.7% of GDP coming from consumption.
This example shows how to analyze an economy's structure by examining the components of GDP. With 59.7% of GDP coming from consumer spending, this economy is highly consumer-dependent. Such economies are sensitive to consumer confidence and spending patterns. The trade deficit (negative net exports) slightly reduces total GDP.
Consumer-Driven Economy: Economy where consumption is the largest GDP component
Economic Structure: Composition of different sectors in the economy
Trade Balance: Difference between exports and imports
• Consumer spending typically dominates GDP in developed economies
• Trade deficits reduce GDP, surpluses increase GDP
• Investment is crucial for long-term economic growth
• Consumer spending usually represents 60-70% of GDP in developed economies
• Economies with high consumption are sensitive to consumer confidence
• Trade balance affects GDP through net exports
• Not accounting for trade balance in GDP calculation
• Forgetting to convert to percentages when analyzing components
• Misinterpreting the economic implications of component ratios
A country's GDP components are: Consumption = $15 trillion, Investment = $2 trillion, Government = $4 trillion, Exports = $3 trillion, Imports = $2.5 trillion. If the government increases spending by $0.5 trillion and this leads to a multiplier effect of 1.5, what would be the new GDP? Assume no change in other components.
Step 1: Calculate initial GDP
GDP = $15T + $2T + $4T + ($3T - $2.5T) = $15T + $2T + $4T + $0.5T = $21.5T
Step 2: Calculate the increase in government spending
New government spending = $4T + $0.5T = $4.5T
Step 3: Apply the multiplier effect
Direct increase = $0.5T
Multiplier effect = $0.5T × 1.5 = $0.75T
Total increase = $0.5T + $0.75T = $1.25T
Step 4: Calculate new GDP
New GDP = $21.5T + $1.25T = $22.75T
This example demonstrates the multiplier effect in macroeconomics. When the government increases spending, it creates additional economic activity beyond the initial injection. The multiplier effect occurs because the initial spending becomes income for others, who then spend a portion of it, creating a ripple effect throughout the economy.
Multiplier Effect: Increase in final income from initial spending injection
Government Spending Multiplier: Magnitude of GDP increase from government spending
Economic Stimulus: Government action to boost economic activity
• Government spending can stimulate economic growth
• Multiplier effects amplify initial spending increases
• Other components may also change in response to policy
• Multiplier effect depends on marginal propensity to consume
• Government spending has immediate impact on GDP
• Crowding out may occur with excessive government spending
• Forgetting to account for multiplier effects
• Not considering the impact of government spending on other components
• Assuming multiplier effects are constant across all situations
Which of the following is NOT a limitation of GDP as an economic indicator?
The answer is C) Measures all economic activity accurately. This is NOT a limitation of GDP - it's actually a strength. GDP is designed to measure economic activity, though it does have limitations. The other options are genuine limitations: GDP doesn't account for income inequality, environmental costs, or non-market activities like unpaid household work.
While GDP is a valuable economic indicator, it has important limitations that economists and policymakers must consider. GDP focuses on measurable market transactions and doesn't capture many aspects of economic welfare, sustainability, or quality of life. Understanding these limitations is crucial for proper economic analysis and policy-making.
GDP Limitations: Shortcomings in capturing economic welfare
Non-Market Activities: Economic activities not captured in GDP
Quality of Life: Well-being beyond economic measures
• GDP measures market transactions, not overall well-being
• Environmental costs are not subtracted from GDP
• GDP doesn't reflect income distribution
• Use GDP alongside other indicators for comprehensive analysis
• Consider Human Development Index (HDI) for welfare assessment
• Account for environmental costs separately
• Equating GDP with quality of life
• Assuming GDP captures all economic activity
• Not considering environmental and social costs
GDP Basics
Total value of goods/services produced in a country.
\(GDP = C + I + G + (X - M)\)
Where C=Consumption, I=Investment, G=Government, X=Exports, M=Imports.
- Measures production within geographic boundaries
- Counts only finished goods to avoid double counting
- Includes private and public consumption
Applications
Consumption: 60-70%, Investment: 15-20%, Government: 15-20%, Net Exports: ±5%.
- Growth Rate
- Per Capita GDP
- Real vs Nominal GDP
- Purchasing Power Parity
- Doesn't account for income inequality
- Environmental costs not included
- Non-market activities excluded
- Quality of life limitations
FAQ
Q: Why is consumption the largest GDP component?
A: In developed economies, households account for 60-70% of GDP through consumption of goods and services. This reflects consumer-driven economic models.
Q: What's the difference between nominal and real GDP?
A: Nominal GDP uses current prices. Real GDP adjusts for inflation. Real GDP better reflects actual economic growth.