Graphing Calculator Simulator
Plotting tool • 2026 standards
Function Graphing Formulas:
Show the calculator\( f(x) = ax^n + bx^{n-1} + ... + c \)
Where:
- \( f(x) \) = Function output
- \( a, b, c \) = Coefficients
- \( n \) = Degree of polynomial
- \( x \) = Independent variable
Common Functions:
- Linear: \( f(x) = mx + b \)
- Quadratic: \( f(x) = ax^2 + bx + c \)
- Trigonometric: \( f(x) = \sin(x), \cos(x), \tan(x) \)
- Exponential: \( f(x) = a^x \)
- Logarithmic: \( f(x) = \log_a(x) \)
Derivatives:
- Power Rule: \( \frac{d}{dx}[x^n] = nx^{n-1} \)
- Product Rule: \( \frac{d}{dx}[uv] = u'v + uv' \)
- Chain Rule: \( \frac{d}{dx}[f(g(x))] = f'(g(x)) \cdot g'(x) \)
These formulas describe relationships between variables and their rates of change.
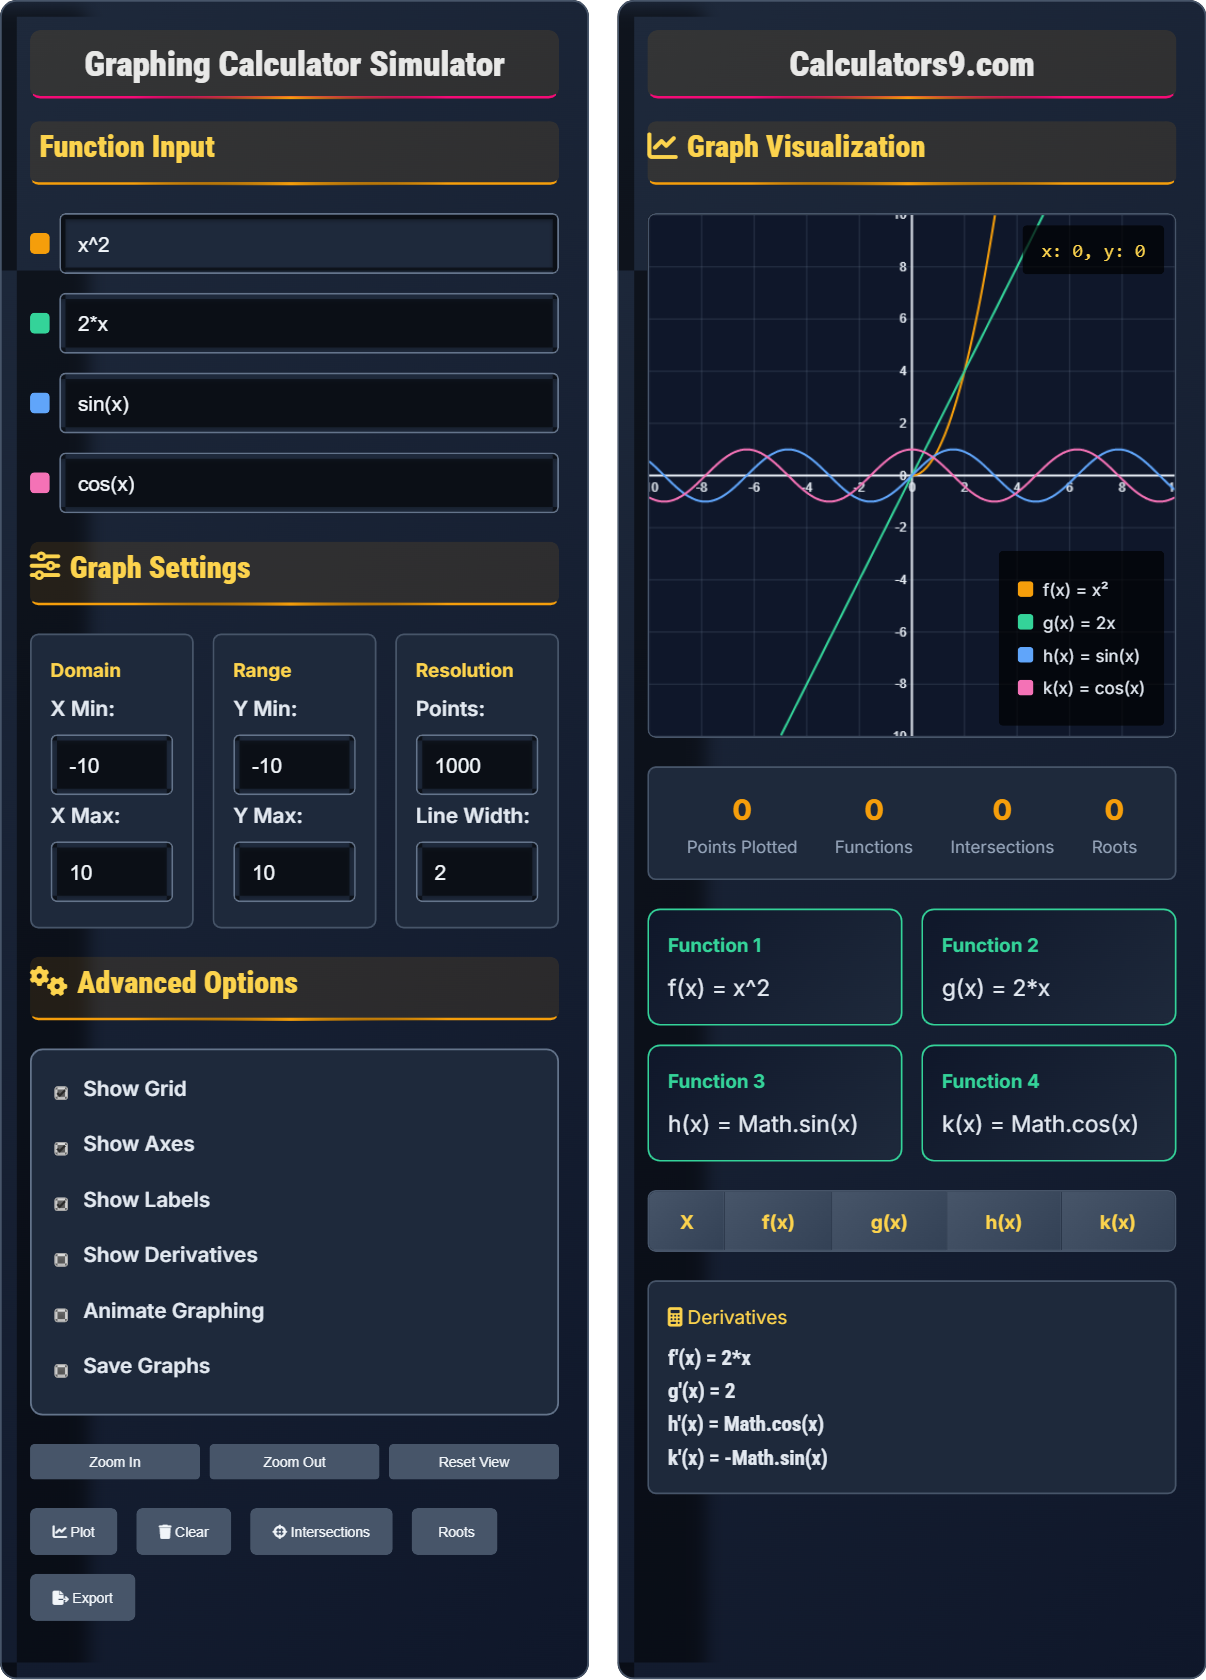
Function Input
Graph Settings
Advanced Options
Graph Visualization
| X | f(x) | g(x) | h(x) | k(x) |
|---|
g'(x) = 2
h'(x) = cos(x)
k'(x) = -sin(x)
Graphing Fundamentals
Function graphing is the process of visualizing mathematical functions by plotting ordered pairs (x, f(x)) on a coordinate plane. It helps understand function behavior, relationships, and properties.
\( f(x) = ax^n + bx^{n-1} + ... + c \)
Where f(x) is the function output, coefficients determine shape, and x is the independent variable.
- Domain and range of functions
- Intercepts and asymptotes
- Increasing/decreasing intervals
- Concavity and inflection points
- Symmetry properties
Advanced Features
Graphing calculators can perform derivatives, integrals, intersections, roots, and transformations. These operations help analyze function behavior and solve equations graphically.
- Derivative analysis for slopes
- Integral calculation for areas
- Intersection finding for solutions
- Root finding for zeros
- Curve fitting for data
- Choose appropriate viewing windows
- Verify with analytical methods
- Check for domain restrictions
- Look for discontinuities
- Validate with known points
Graphing Calculator Learning Quiz
What does the derivative of a function represent graphically?
The answer is B) The slope of the tangent line. The derivative f'(x) represents the instantaneous rate of change of the function at any point x, which geometrically corresponds to the slope of the tangent line to the curve at that point.
The derivative is a fundamental concept in calculus that measures how a function changes as its input changes. Graphically, it represents the steepness of the curve at any given point. When f'(x) > 0, the function is increasing; when f'(x) < 0, the function is decreasing; and when f'(x) = 0, the function has a horizontal tangent.
Derivative: Rate of change of a function with respect to its variable
Tangent Line: Line that touches a curve at a single point
Instantaneous Rate: Rate of change at a specific point
• f'(x) > 0 means function is increasing
• f'(x) < 0 means function is decreasing
• f'(x) = 0 means horizontal tangent
• The derivative graph shows the slope of the original function
• Peaks and valleys of original function correspond to zeros in derivative
• Concavity relates to the second derivative
• Confusing derivative with integral
• Thinking derivative gives area under curve
• Misinterpreting slope signs
Find the derivative of f(x) = 3x⁴ - 2x³ + 5x - 7 using the power rule.
Using the power rule: \( \frac{d}{dx}[x^n] = nx^{n-1} \)
Step 1: \( \frac{d}{dx}[3x^4] = 3 \times 4x^{4-1} = 12x^3 \)
Step 2: \( \frac{d}{dx}[-2x^3] = -2 \times 3x^{3-1} = -6x^2 \)
Step 3: \( \frac{d}{dx}[5x] = 5 \times 1x^{1-1} = 5 \)
Step 4: \( \frac{d}{dx}[-7] = 0 \) (constant rule)
Therefore, f'(x) = 12x³ - 6x² + 5
The power rule is fundamental for differentiating polynomial functions. It states that when differentiating x raised to any power, you bring down the power as a coefficient and reduce the exponent by one. This rule, combined with the constant multiple rule and sum rule, allows differentiation of any polynomial.
Power Rule: d/dx[x^n] = nx^(n-1)
Constant Rule: Derivative of constant is zero
Polynomial: Sum of terms with non-negative integer powers
• Bring down the exponent as coefficient
• Subtract 1 from the exponent
• Constants differentiate to zero
• Apply the rule to each term separately
• Remember that x⁰ = 1
• Check your answer by verifying units
• Forgetting to subtract 1 from exponent
• Not bringing down the exponent as coefficient
• Incorrectly differentiating constants
Find the intersection points of f(x) = x² and g(x) = 2x by solving the equation f(x) = g(x).
Step 1: Set functions equal: x² = 2x
Step 2: Rearrange: x² - 2x = 0
Step 3: Factor: x(x - 2) = 0
Step 4: Solve: x = 0 or x = 2
Step 5: Find y-coordinates: f(0) = 0² = 0 and f(2) = 2² = 4
Therefore, intersection points are (0, 0) and (2, 4).
Intersection points occur where two functions have the same output for the same input. Setting f(x) = g(x) finds x-values where this occurs. Substituting back into either function gives the corresponding y-values. Graphically, these are the points where the curves cross.
Intersection Point: Point where two functions have same coordinates
System of Equations: Multiple equations to solve simultaneously
Algebraic Solution: Using algebra to find exact values
• Set functions equal to find x-coordinates
• Substitute back to find y-coordinates
• Verify solutions in original equations
• Factor polynomials when possible
• Use quadratic formula for quadratics
• Graph to verify solutions
• Only solving for x and forgetting y
• Factoring errors
• Not checking solutions
What are the amplitude and period of the function f(x) = 3sin(2x + π/4)?
For f(x) = A sin(Bx + C):
• Amplitude = |A| = |3| = 3
• Period = 2π/|B| = 2π/|2| = π
• Phase shift = -C/B = -(π/4)/2 = -π/8
Therefore, amplitude is 3 and period is π radians.
Trigonometric functions have specific parameters that define their shape. The amplitude determines the vertical stretch, the period determines how frequently the function repeats, and the phase shift determines horizontal displacement. Understanding these parameters helps predict function behavior.
Amplitude: Maximum displacement from equilibrium
Period: Length of one complete cycle
Phase Shift: Horizontal displacement of the function
• Amplitude = |coefficient of trig function|
• Period = 2π/|coefficient of x|
• Phase shift = -constant term/coefficient of x
• Rewrite function in standard form first
• Factor out coefficient of x when needed
• Use unit circle for verification
• Confusing amplitude with period
• Forgetting to divide by coefficient of x for period
• Incorrectly calculating phase shift
What is the domain and range of f(x) = √(x - 2)?
The answer is A) Domain: x ≥ 2, Range: y ≥ 0. For the square root to be defined, the expression under the radical must be non-negative: x - 2 ≥ 0, so x ≥ 2. The square root function always produces non-negative results, so y ≥ 0.
The domain of a function consists of all valid input values, while the range consists of all possible output values. For radical functions, the radicand (expression under the radical) must be non-negative. For the square root function, outputs are always non-negative.
Domain: Set of all possible input values
Range: Set of all possible output values
Radicand: Expression under the radical symbol
• Radicand must be ≥ 0 for even roots
• Square root function outputs ≥ 0
• Consider function restrictions
• Set radicand ≥ 0 to find domain
• Consider function behavior for range
• Graph function to verify
• Forgetting to consider radicand restrictions
• Confusing domain with range
• Not considering function behavior
FAQ
Q: How do I find the derivative of a function using a graphing calculator?
A: The derivative of a function f(x) can be found using the formula \( f'(x) = \lim_{h \to 0} \frac{f(x+h) - f(x)}{h} \). However, graphing calculators use the power rule and other differentiation rules:
For \( f(x) = ax^n \), the derivative is \( f'(x) = nax^{n-1} \)
Common derivative rules:
• Power rule: \( \frac{d}{dx}[x^n] = nx^{n-1} \)
• Product rule: \( \frac{d}{dx}[uv] = u'v + uv' \)
• Chain rule: \( \frac{d}{dx}[f(g(x))] = f'(g(x)) \cdot g'(x) \)
Most graphing calculators have built-in derivative functions that apply these rules automatically.
Q: What's the difference between graphing calculators and computer algebra systems?
A: Graphing calculators focus on visualizing functions and performing numerical calculations. They use discrete sampling to plot points and connect them with lines.
Computer Algebra Systems (CAS) can perform symbolic mathematics, solving equations algebraically and providing exact answers.
For example, a graphing calculator might approximate \( \int_0^1 x^2 dx \) numerically as 0.3333, while a CAS would give the exact answer of 1/3.
Both tools complement each other in mathematical problem-solving.