Reaction Time Tester
Fast response calculator • 2026 standards
Reaction Time Formula:
Show the calculator\( RT = T_{response} - T_{stimulus} \)
Where:
- \( RT \) = Reaction Time (milliseconds)
- \( T_{response} \) = Time of response registration
- \( T_{stimulus} \) = Time of stimulus presentation
For multiple trials, average reaction time is calculated as:
\( RT_{avg} = \frac{\sum_{i=1}^{n} RT_i}{n} \)
Standard deviation measures consistency:
\( SD = \sqrt{\frac{\sum_{i=1}^{n} (RT_i - RT_{avg})^2}{n}} \)
This formula calculates the time elapsed between stimulus presentation and response registration, measuring neurological processing speed.
Example: If stimulus appears at 1000ms and response occurs at 1250ms:
\( RT = 1250 - 1000 = 250 \) milliseconds
Thus, the reaction time is 250 milliseconds.
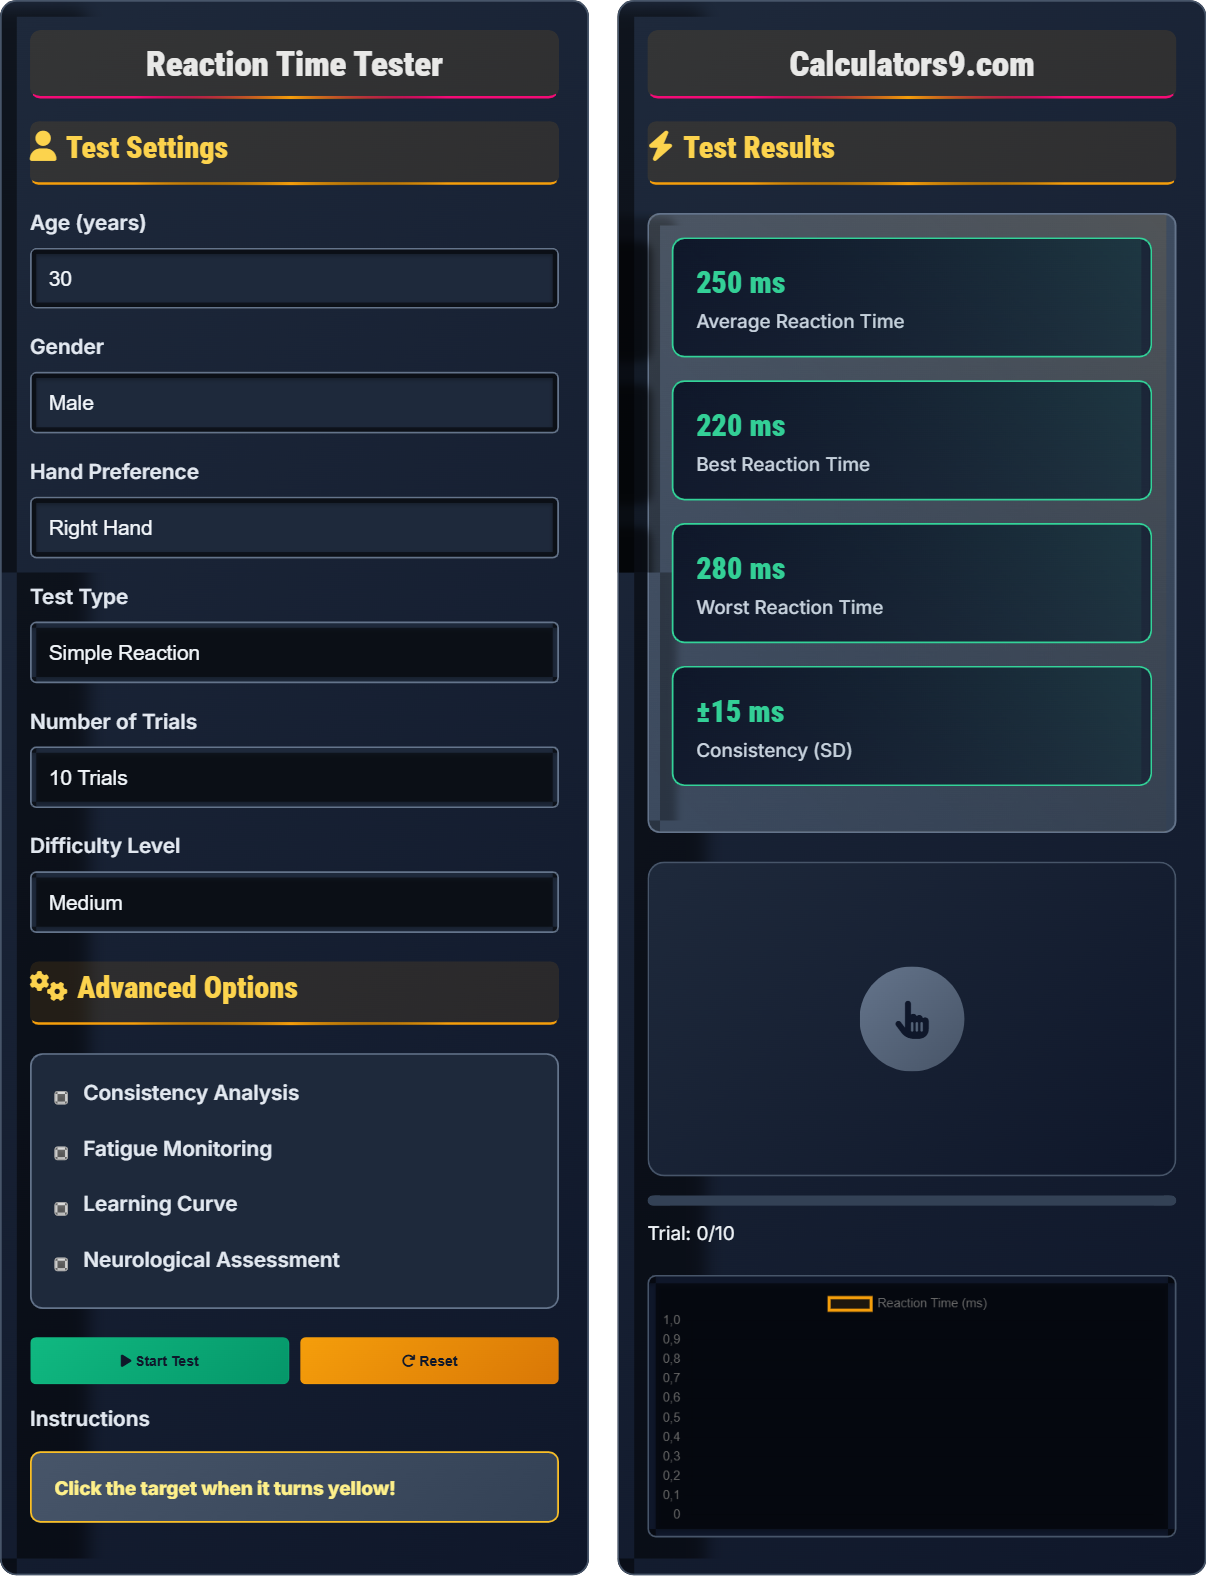
Test Settings
Advanced Options
Test Results
| Metric | Value | Range | Performance |
|---|
| Factor | Impact | Score | Recommendation |
|---|
Comprehensive Neurological Assessment Guide
Reaction time is the interval between the presentation of a stimulus and the initiation of a response. It measures the speed of neural processing and motor response. Simple reaction time involves responding to a single stimulus, while choice reaction time requires selecting among multiple responses based on different stimuli.
Reaction time consists of several components:
Where:
- \(S\) = Sensory processing time
- \(T\) = Neural transmission time
- \(M\) = Motor response time
Reaction time varies based on multiple factors:
- Age: Peaks in 20s, declines after 30
- Stimulus Type: Auditory fastest, visual slower
- Practice: Improves with training
- Alertness: Affected by fatigue, caffeine
- Health: Neurological conditions affect RT
- Regular Exercise: Enhances neural pathways
- Sleep Hygiene: Adequate rest improves processing
- Cognitive Training: Brain games and puzzles
- Nutrition: Proper diet supports brain function
- Stress Management: Reduces cognitive load
Reaction Time Basics
Time between stimulus and response initiation.
\(RT = T_{response} - T_{stimulus}\)
Where RT=reaction time, T=response time, T=stimulus time.
- Simple RT < Choice RT
- Auditory fastest
- Improves with practice
Performance Factors
Simple: 200-250ms for adults.
- Regular cognitive exercises
- Adequate sleep
- Physical fitness
- Stress reduction
- Age affects performance
- Fatigue impacts results
- Consistency matters
- Regular testing recommended
Reaction Time Learning Quiz
Which of the following is NOT a component of reaction time?
The answer is C) Digestive Processing. Reaction time components include sensory processing (detecting the stimulus), neural transmission (sending signals through the nervous system), and motor response (executing the action). Digestive processing is not involved in the immediate neural pathway for reaction time.
Understanding the components of reaction time helps identify where delays might occur. The formula RT = S + T + M breaks down the process: Sensory processing (S) involves detecting and interpreting the stimulus, Neural transmission (T) involves signal conduction through neurons, and Motor response (M) involves muscle activation to execute the response.
Reaction Time (RT): Time from stimulus to response
Sensory Processing: Detection and interpretation of stimulus
Motor Response: Physical execution of response
• RT = Sensory + Neural + Motor time
• Each component can be trained independently
• Delays can occur at any stage
• Remember: Stimulus → Brain → Action
• Practice can improve each component
• Confusing reaction time with movement time
• Overlooking the neural transmission component
If a stimulus appears at 1500ms and the subject responds at 1750ms, what is the reaction time? If the subject completes 5 trials with times of 250ms, 230ms, 270ms, 240ms, and 260ms, what is the average reaction time?
Part 1: Reaction time = Response time - Stimulus time
RT = 1750 - 1500 = 250ms
Part 2: Average reaction time calculation:
Sum = 250 + 230 + 270 + 240 + 260 = 1250ms
Average = 1250 ÷ 5 = 250ms
Therefore, the single trial RT is 250ms and the average RT is 250ms.
This calculation demonstrates the basic principle of reaction time measurement. Multiple trials provide a more reliable measure by averaging out random variations. The standard deviation would indicate consistency across trials, which is also important for assessing neurological function.
Single Trial RT: Reaction time for one measurement
Average RT: Mean of multiple trials
Consistency: Variation across trials
• RT = Response time - Stimulus time
• Multiple trials provide more reliable data
• Consistency indicates reliability
• Use millisecond precision for accuracy
• Calculate both mean and variation
• More trials = more reliable average
• Subtracting in wrong order
• Forgetting to divide by number of trials
• Ignoring trial-to-trial variation
A 25-year-old athlete has an average reaction time of 200ms. Research shows that reaction time increases by approximately 15ms per decade after age 30. Predict the athlete's reaction time at age 55, assuming no training adaptations. How does this compare to the general population norm for 55-year-olds (280ms)?
Step 1: Calculate the time period = 55 - 25 = 30 years
Step 2: Determine age-related increase = (55 - 30) ÷ 10 × 15ms = 25 ÷ 10 × 15 = 37.5ms
Step 3: Predicted RT = 200ms + 37.5ms = 237.5ms
Step 4: Compare to population norm = 280ms (general) vs 237.5ms (trained athlete)
Therefore, the athlete's predicted RT at 55 is 237.5ms, which is still better than the general population norm of 280ms.
This problem illustrates the interaction between natural aging and training effects. While reaction time does decline with age, athletic training and continued practice can mitigate this decline. The athlete maintains superior performance even with age-related changes, demonstrating the protective effects of regular training.
Age-Related Decline: Natural slowing with age
Training Adaptation: Maintenance through practice
Population Norm: Average for age group
• RT increases ~15ms per decade after 30
• Training can slow decline
• Individual variation exists
• Start training early for best results
• Consistent practice maintains performance
• Age-related changes are gradual
• Assuming decline is inevitable regardless of training
• Calculating age increase incorrectly
• Not accounting for individual differences
During a reaction time test, a subject performs 20 trials. Their first 5 trials average 220ms, but by the last 5 trials, the average increases to 260ms. Calculate the fatigue-induced increase in reaction time. What percentage increase does this represent? What strategies could minimize this fatigue effect?
Step 1: Calculate fatigue increase = 260ms - 220ms = 40ms
Step 2: Calculate percentage increase = (40 ÷ 220) × 100% = 18.2%
Step 3: Strategies to minimize fatigue:
- Take brief breaks between trials
- Stay hydrated
- Ensure adequate lighting
- Use shorter test sessions
- Maintain motivation
Therefore, fatigue increased RT by 40ms (18.2%), which is significant.
This demonstrates how cognitive and physical fatigue affects reaction time. The 18.2% increase is substantial and can skew results. Understanding fatigue effects is crucial for accurate assessment and for designing effective training programs that account for performance changes over time.
Cognitive Fatigue: Mental tiredness affecting performance
Performance Drift: Change over time
Test Reliability: Consistency across trials
• Monitor for performance changes
• Limit sessions to 10-15 trials
• Include warm-up trials
• Monitor attention levels
• Ignoring fatigue effects on results
• Conducting overly long test sessions
• Not accounting for performance drift
Which sequence correctly orders reaction times from fastest to slowest?
The answer is A) Auditory → Visual → Tactile → Complex Choice. Auditory stimuli typically produce the fastest reaction times (150-200ms), followed by visual stimuli (180-220ms), tactile stimuli (200-250ms), and complex choice reactions (250-350ms+) which require additional cognitive processing.
Different sensory modalities have varying processing speeds due to differences in neural pathways and processing complexity. Auditory processing is fastest because sound travels directly to the brainstem, while complex choice reactions require additional cognitive steps including stimulus identification, decision-making, and response selection.
Simple RT: One stimulus, one response
Choice RT: Multiple stimuli, multiple responses
Sensory Modality: Type of stimulus (auditory, visual, etc.)
• Auditory fastest, visual moderate, tactile slower
• Choice RT > Simple RT
• Complexity increases RT
• Use auditory cues for fastest responses
• Simplify choices when speed is critical
• Consider modality in design
• Assuming all stimuli have equal processing time
• Not considering cognitive complexity
• Overlooking sensory modality effects
FAQ
Q: How can I improve my reaction time for competitive gaming?
A: Improving reaction time for gaming involves optimizing multiple systems. First, focus on consistent practice with gaming-specific reaction tasks. This creates neural pathways optimized for game scenarios.
Second, ensure adequate sleep (7-9 hours) as fatigue significantly impairs reaction time. Third, consider nutrition - caffeine in moderation can enhance alertness, while proper hydration maintains cognitive function.
Research shows that elite gamers have reaction times of 150-180ms compared to 200-250ms for casual players. This improvement comes from pattern recognition and predictive processing developed through extensive practice.
Mathematically, if \( RT_0 \) is initial time and \( T \) is training effect, then: \( RT_{final} = RT_0 \times (1 - T) \). For serious gamers, \( T \) can reach 0.20-0.30, representing 20-30% improvement.
Q: What's the relationship between reaction time and driving safety?
A: Reaction time is critical for driving safety. At highway speeds, a 50ms difference in reaction time translates to significant distance traveled before braking. For example, at 60 mph (88 ft/s), 50ms = 4.4 feet of additional travel distance.
Studies show that drivers with reaction times exceeding 250ms have significantly higher accident rates. Factors like fatigue, alcohol, distractions can add 100-200ms to reaction time.
The stopping distance formula includes reaction time: \( D = (RT \times Speed) + Braking Distance \). If \( RT \) increases from 200ms to 300ms at 60 mph, the additional reaction distance is: \( (0.1 \times 88) = 8.8 \) feet before braking begins.
Regular reaction time testing helps identify when cognitive function may be impaired for safe driving.