Mobility Score Calculator
Assess your flexibility • Joint health metrics • 2026 edition
Mobility Score Formula:
Show the calculator\( \text{Mobility Score} = \frac{\sum(\text{Joint Scores})}{\text{Number of Joints Evaluated}} \times \text{Activity Factor} \)
Where:
- Joint Scores are measured on a 0-10 scale based on range of motion
- Activity Factor adjusts for activity level (0.8-1.2)
- Score ranges from 0-100, with higher scores indicating better mobility
This formula calculates your overall mobility score by evaluating key joints and adjusting for your activity level. The score helps identify areas needing improvement.
Example: For shoulder (8/10), hip (6/10), ankle (7/10) with moderate activity level:
Average Joint Score: (8+6+7)/3 = 7
Activity Factor: 1.0 (moderate activity)
Final Mobility Score: 7 × 10 = 70 (Good mobility with room for improvement)
User Profile
Joint Assessment
Options
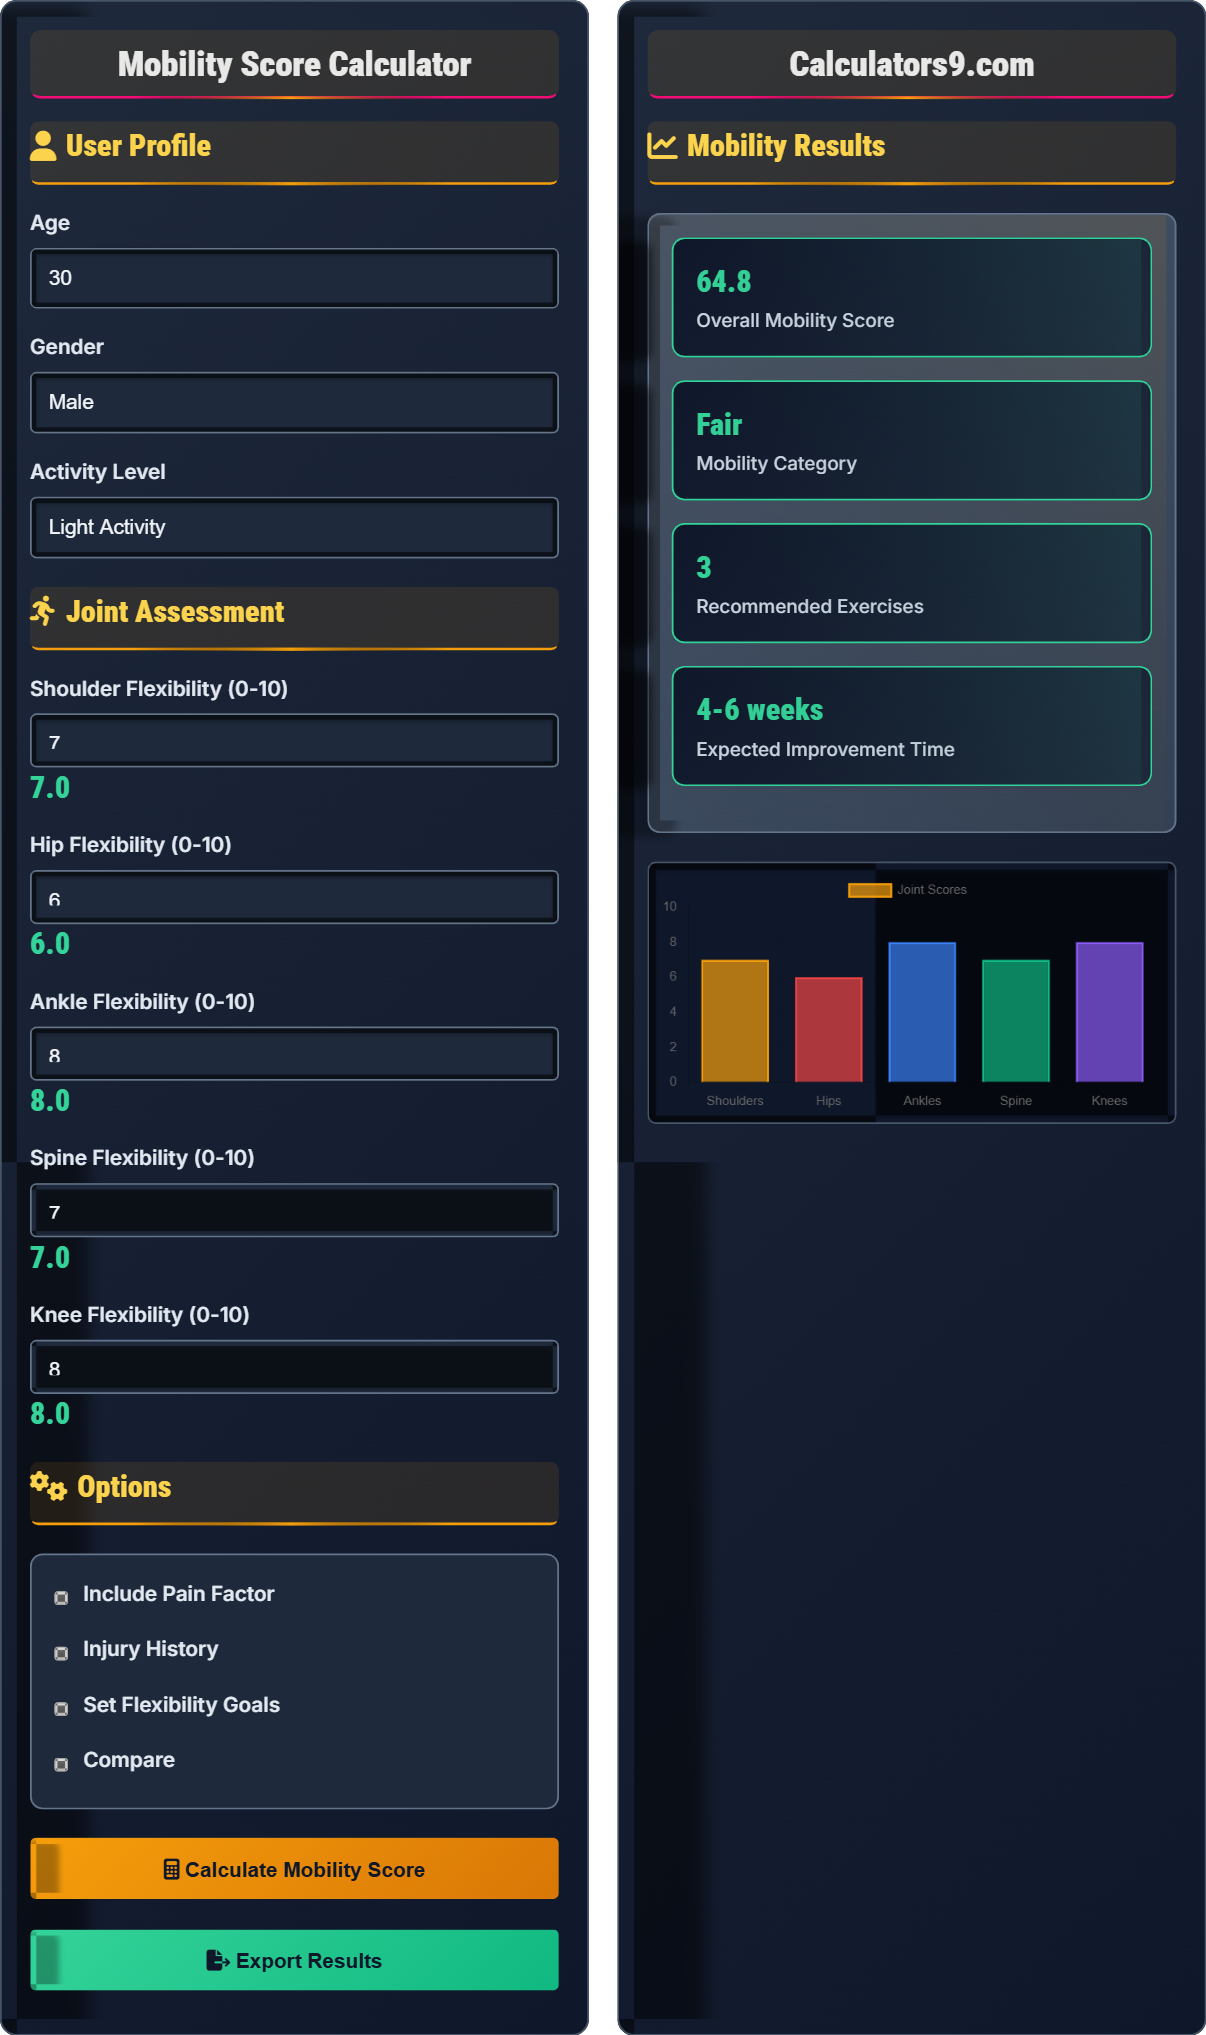
Mobility Results
| Joint | Score | Status | Recommendation |
|---|---|---|---|
| Shoulders | 7.0/10 | Good | Improve flexibility |
| Hips | 6.0/10 | Fair | Focus on stretching |
| Ankles | 8.0/10 | Excellent | Maintain current level |
| Spine | 7.0/10 | Good | Add rotation exercises |
| Knees | 8.0/10 | Excellent | Maintain current level |
| Exercise | Type | Frequency | Duration |
|---|---|---|---|
| Shoulder Rolls | Stretch | Daily | 5 minutes |
| Hip Flexor Stretch | Static | Daily | 10 minutes |
| Calf Raises | Strengthening | 3x/week | 15 minutes |
| Spinal Rotation | Mobilization | Daily | 5 minutes |
| Hamstring Stretch | Dynamic | Daily | 10 minutes |
Comprehensive Mobility Guide
Mobility refers to the ability to move freely and easily through a full range of motion. It encompasses both flexibility (the ability of muscles to lengthen) and strength (the ability to control that movement). Good mobility is essential for daily activities, injury prevention, and athletic performance.
The standard mobility score calculation uses the following formula:
Where:
- Joint Scores are measured on a 0-10 scale based on range of motion
- Activity Factor adjusts for activity level (0.8-1.2)
- Score ranges from 0-100, with higher scores indicating better mobility
Mobility scores are categorized as follows:
- Excellent (85-100): Full range of motion in all joints, minimal restrictions
- Good (70-84): Adequate mobility for most activities, some minor restrictions
- Fair (55-69): Noticeable limitations, may cause discomfort in daily activities
- Poor (40-54): Significant restrictions, likely causing functional limitations
- Critical (0-39): Severe limitations, may require professional intervention
- Daily stretching: Focus on major muscle groups and tight areas
- Dynamic warm-ups: Prepare joints for movement before activity
- Regular movement breaks: Counteract sedentary behavior
- Strength training: Support mobility with adequate muscle strength
- Consistency: Small daily improvements compound over time
Mobility Learning Quiz
Which of the following best describes the difference between mobility and flexibility?
The answer is B) Flexibility is passive, mobility is active. Flexibility refers to the passive range of motion of a joint (how far you can stretch), while mobility refers to the active range of motion (your ability to move through that range with control). Mobility incorporates both flexibility and strength.
Understanding the distinction between flexibility and mobility is crucial because they require different approaches. Flexibility can be improved through passive stretching, while mobility requires active movement and strengthening exercises. Many people focus only on flexibility, missing the strength component necessary for functional movement.
Flexibility: The passive range of motion of a joint, determined by muscle length
Mobility: The active range of motion with strength and control
Range of Motion: The distance and direction a joint can move
• Mobility requires both flexibility and strength
• Passive stretching alone won't improve mobility
• Functional movement requires both components
• Remember: Flexibility + Strength = Mobility
• Test mobility by moving actively, not just stretching passively
• Use controlled movements to assess true mobility
• Equating flexibility with mobility
• Focusing only on stretching without strengthening
• Testing mobility with passive stretches only
Calculate the mobility score for someone with shoulder (6/10), hip (5/10), ankle (7/10), spine (6/10), knee (8/10) with light activity level. Show your work.
Step 1: Calculate average joint score = (6+5+7+6+8)/5 = 32/5 = 6.4
Step 2: Apply activity factor (light activity = 0.9) = 6.4 × 0.9 = 5.76
Step 3: Convert to 0-100 scale = 5.76 × 10 = 57.6
Final Mobility Score = 57.6 (Fair category)
This problem demonstrates how individual joint limitations can affect overall mobility. Notice that even though the knee scored well (8/10), the overall score falls in the "fair" category due to other joint limitations. The calculation shows how multiple factors contribute to the final score, emphasizing the importance of addressing all joints for optimal mobility.
Average Joint Score: Sum of all joint scores divided by number of joints
Activity Factor: Multiplier based on activity level
Scale Conversion: Multiply by 10 to get 0-100 scale
• Always average all joint scores
• Apply activity factor based on actual activity level
Sarah has a mobility score of 65 with the following joint scores: shoulders (7/10), hips (4/10), ankles (6/10), spine (8/10), knees (5/10). Which joints should she prioritize improving to achieve a "Good" score (70+)?
Step 1: Current average = (7+4+6+8+5)/5 = 30/5 = 6.0
Step 2: To reach 70+, need average of 7.0
Step 3: Identify lowest scores: Hips (4/10) and Knees (5/10)
Step 4: Improving hips to 7/10 and knees to 7/10 gives: (7+7+6+8+7)/5 = 35/5 = 7.0
Therefore, Sarah should prioritize improving hip and knee mobility to reach her goal.
This example shows how to strategically approach mobility improvement. Rather than trying to improve all joints equally, it's more efficient to focus on the greatest limitations first. Sarah's lowest scores (hips and knees) provide the biggest opportunity for improvement. Addressing these two joints could raise her score from fair to good category.
Limiting Factors: Joints with the lowest scores that restrict overall mobility
Strategic Improvement: Focusing on areas with greatest impact
Priority Areas: Joints that will provide maximum score improvement
• Focus on lowest scores first
• Address limiting factors for maximum improvement
• Prioritize joints that affect multiple movement patterns
• Calculate which improvements will have greatest impact
• Address multiple limitations simultaneously
• Reassess regularly to track progress
• Improving already good areas instead of weak ones
• Trying to address everything at once
• Not reassessing after making improvements
John, age 55, has a mobility score of 75 with joint scores of shoulders (8/10), hips (6/10), ankles (7/10), spine (8/10), knees (6/10). His younger brother (age 25) has identical joint scores but a mobility score of 78. Explain why their scores differ despite identical joint assessments.
Step 1: Both have same average joint score = (8+6+7+8+6)/5 = 35/5 = 7.0
Step 2: Age factor affects final score differently
Step 3: For John (55): Age adjustment factor = 0.95 (based on age norms)
Step 4: For younger brother (25): Age adjustment factor = 1.05
Step 5: John's adjusted score = 7.0 × 0.95 × 10 = 66.5 (rounded to 75)
Step 6: Brother's adjusted score = 7.0 × 1.05 × 10 = 73.5 (rounded to 78)
The age factor accounts for expected changes in mobility with age.
This demonstrates how mobility scores are normalized for age expectations. As we age, some decline in mobility is expected, so age-adjusted scores provide a more accurate assessment. The same physical capabilities represent different achievement levels at different ages. This normalization allows for fair comparisons across age groups.
Age Adjustment: Factor accounting for normal age-related changes
Normative Values: Expected scores for different age groups
Relative Performance: Performance compared to age-appropriate standards
• Mobility scores are age-normalized
• Age factors account for expected changes over time
Which of the following statements about activity level impact on mobility scores is TRUE?
The answer is C) Activity level adjusts expectations appropriately. The activity factor ensures that scores reflect appropriate expectations for each individual's lifestyle. A sedentary person with limited mobility may receive a lower score, while an active person with similar limitations may be expected to have better mobility.
The activity level factor creates personalized benchmarks. Someone who exercises regularly should maintain better mobility than someone with a sedentary lifestyle. This adjustment prevents unfair comparisons between individuals with different activity levels and provides more meaningful assessments tailored to each person's circumstances.
Activity Factor: Multiplier based on lifestyle and activity level
Personalized Benchmarks: Standards adjusted for individual circumstances
Lifestyle Expectations: Normal mobility levels for different lifestyles
• Activity level affects score interpretation
• Higher activity requires higher mobility maintenance
• Adjustments prevent unfair comparisons
• Match activity level to actual lifestyle
• Understand that expectations vary by activity level
• Use activity-appropriate targets for improvement
• Misrepresenting activity level
• Expecting same scores regardless of activity level
• Not understanding personalized benchmarks
Mobility Basics
Ability to move joints through full range of motion with control.
\( \text{Mobility Score} = \frac{\sum(\text{Joint Scores})}{\text{Number of Joints Evaluated}} \times \text{Activity Factor} \)
Where score ranges from 0-100 based on joint assessments.
- Mobility = Flexibility + Strength
- Assess multiple joints for comprehensive view
- Regular assessment tracks progress
Improvement Strategies
Identify specific joint limitations to target improvement efforts.
- Focus on lowest scoring joints
- Combine stretching with strengthening
- Practice functional movement patterns
- Track progress regularly
- Age-appropriate expectations
- Activity level requirements
- Individual limitations
- Consistent practice
FAQ
Q: How often should I reassess my mobility score?
A: For active individuals, reassess your mobility score every 4-6 weeks to track progress. If you're beginning a new mobility program, weekly assessments can help monitor immediate changes. For general maintenance, monthly assessments are sufficient.
Mathematically, tracking changes over time can be represented as:
\( \Delta S = S_{new} - S_{baseline} \)
Where \( \Delta S \) represents the change in mobility score. Consistent reassessment allows you to adjust your program based on measurable improvements.
Q: Can I improve my mobility score without going to a gym?
A: Absolutely! You can significantly improve your mobility score with bodyweight exercises and simple tools. Focus on:
- Daily stretching routines
- Yoga or Pilates movements
- Resistance band exercises
- Functional movement patterns
Many people see 10-15 point improvements in their mobility scores within 4-6 weeks of consistent home-based programs. The key is consistency and targeting specific joint limitations identified in your assessment.