Glycemic Index Load Calculator
Blood Sugar Impact Tracker • 2026 Standards
Glycemic Index and Load Formulas:
Show the calculatorGlycemic Index (GI): \( \text{GI} = \frac{\text{Blood Glucose Response of Test Food}}{\text{Blood Glucose Response of Reference Food}} \times 100 \)
Glycemic Load (GL): \( \text{GL} = \frac{\text{GI} \times \text{Available Carbs (g)}}{100} \)
Available Carbs: \( \text{Available Carbs} = \text{Total Carbs} - \text{Fiber} \)
Meal GL: \( \text{Total GL} = \sum(\text{GL of each food item}) \)
GL Categories:
- Low GL: ≤10
- Moderate GL: 11-19
- High GL: ≥20
These formulas help predict how specific foods and meals will affect blood sugar levels. The GI measures how quickly carbohydrates raise blood sugar compared to pure glucose, while GL considers portion size and provides a more practical measure of glycemic impact.
Example: For 120g of watermelon (GI=72, carbs=11.5g):
- Available carbs = 11.5g - 0.6g fiber = 10.9g
- GL = (72 × 10.9) ÷ 100 = 7.8
- This is a low GL meal despite watermelon's high GI
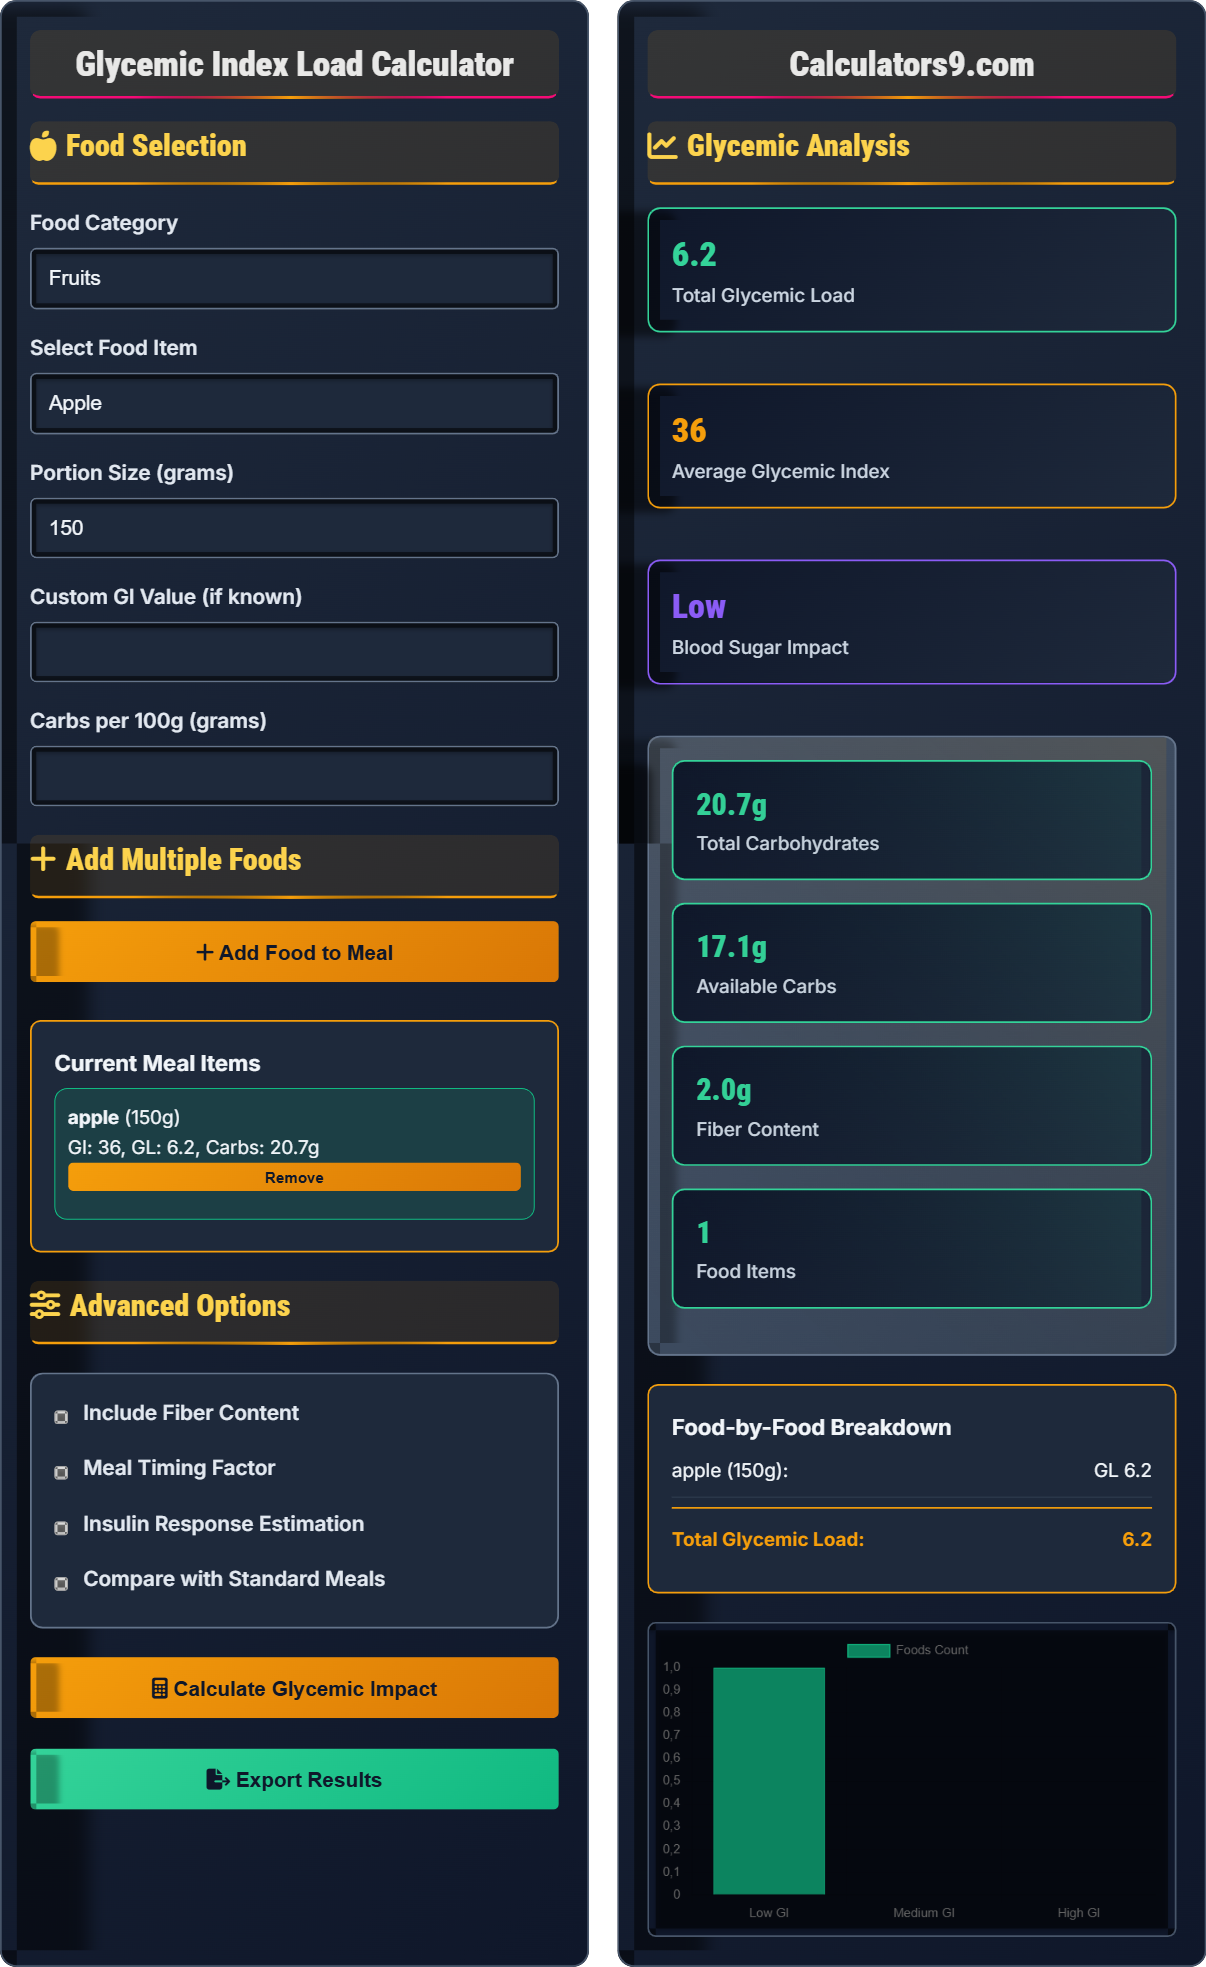
Food Selection
Add Multiple Foods
Current Meal Items
Advanced Options
Glycemic Analysis
Food-by-Food Breakdown
Comprehensive Glycemic Index and Load Guide
The Glycemic Index (GI) ranks carbohydrates based on how quickly they raise blood glucose levels compared to pure glucose. The Glycemic Load (GL) takes into account both the GI and the amount of carbohydrate in a serving. GL provides a more practical measure of a food's actual impact on blood sugar levels.
GI and GL values are categorized as follows:
- Low GI: 0-55 (minimal blood sugar impact)
- Medium GI: 56-69 (moderate impact)
- High GI: 70+ (significant impact)
- Low GL: 0-10 (safe for diabetics)
- Moderate GL: 11-19 (acceptable)
- High GL: 20+ (limit intake)
Research shows that low-GI and low-GL diets offer several health benefits:
- Improved blood sugar control in diabetics
- Reduced risk of type 2 diabetes
- Lower cardiovascular disease risk
- Better weight management
- Increased satiety and reduced hunger
- Diabetes Management: Aim for GL < 10 per meal
- Weight Loss: Focus on low-GI foods for satiety
- Energy Balance: Combine high and low GI foods strategically
- Exercise Timing: Higher GI foods before workouts
- Evening Meals: Lower GI foods for better sleep
Nutritional Science
GI measures how much a carbohydrate-containing food raises blood glucose levels after eating.
Test subjects consume 50g of available carbohydrates from test food after overnight fast.
- Glucose = GI of 100 (reference standard)
- Test food compared to glucose response
- Portion contains 50g available carbs
Clinical Applications
Recommended GI/GL values for different health conditions and goals.
- Diabetic patients: GL < 10 per meal
- Weight loss: Daily GL < 80
- General health: Mix of low-medium GI foods
- Athletes: Strategic high GI before exercise
- Individual responses vary significantly
- Food combinations affect overall impact
- Cooking methods can alter GI values
- Processing often increases GI
Glycemic Index and Load Quiz
What is the key difference between Glycemic Index (GI) and Glycemic Load (GL)?
The answer is B) GI measures speed of glucose rise, GL considers portion size. The Glycemic Index measures how quickly a food raises blood sugar compared to pure glucose, while Glycemic Load incorporates both the GI and the amount of carbohydrates in a serving, providing a more practical measure of actual impact.
The GI is a relative ranking of carbohydrates in foods from 0 to 100 based on how they affect blood glucose levels. GL adjusts this by accounting for the actual amount of carbohydrates consumed. For example, watermelon has a high GI (72) but a low GL (7.8 for 120g) because it contains relatively few carbohydrates per serving.
Glycemic Index (GI): Ranking of carbohydrates based on blood glucose response
Glycemic Load (GL): Measure incorporating both GI and carbohydrate content
Available Carbohydrates: Total carbs minus fiber content
• GI compares speed of glucose elevation
• GL considers serving size impact
• GL is more practical for meal planning
• Use GL for practical meal planning
• Low GL = ≤10, Moderate = 11-19, High = ≥20
• Consider both GI and GL for optimal choices
• Confusing GI with sugar content
• Ignoring portion sizes when considering GI
• Not understanding that GL is more practical than GI
Calculate the Glycemic Load for 150g of brown rice with a GI of 55 and 28g of carbohydrates per 100g serving.
Using the GL formula: \( \text{GL} = \frac{\text{GI} \times \text{Available Carbs}}{100} \)
Step 1: Calculate carbohydrates in 150g portion
Carbs in 150g = (28g/100g) × 150g = 42g
Step 2: Apply the GL formula
GL = (55 × 42) ÷ 100 = 2310 ÷ 100 = 23.1
Therefore, the GL for 150g of brown rice is 23.1, which is considered high GL.
This calculation demonstrates how GL accounts for both the quality (GI) and quantity (carbohydrate content) of carbohydrates. Even though brown rice has a moderate GI, a larger portion creates a high GL, which would significantly impact blood sugar levels.
Glycemic Load: Product of GI and available carbohydrates
Available Carbs: Total carbs minus fiber contentPortion Scaling: Adjusting carb content based on actual serving size
• Always scale carbohydrate content to actual portion
• GL = (GI × Available Carbs) ÷ 100
• Consider fiber when calculating available carbs
• Scale carbs proportionally to portion size
• Remember: GL = (GI × Carbs in portion) ÷ 100
• Subtract fiber from total carbs for available carbs
• Forgetting to divide by 100 in the formula
• Not accounting for fiber in available carbs calculation
Sarah is managing her diabetes and wants to prepare a lunch with a total GL under 20. She plans to include 100g of basmati rice (GI=58, carbs=25g/100g), 100g of chickpeas (GI=28, carbs=27g/100g), and 150g of grapes (GI=46, carbs=18g/100g). What will be the total GL of her meal, and is it appropriate for her needs?
Basmati rice (100g):
GL = (58 × 25) ÷ 100 = 14.5
Chickpeas (100g):
GL = (28 × 27) ÷ 100 = 7.56
Grapes (150g):
Carbs in 150g = (18g/100g) × 150g = 27g
GL = (46 × 27) ÷ 100 = 12.42
Total GL = 14.5 + 7.56 + 12.42 = 34.48
Since 34.48 > 20, this meal exceeds Sarah's target GL for diabetes management.
This example demonstrates how to calculate total GL for multi-food meals. It also illustrates that even foods with moderate GI values can combine to create a high-GL meal. Sarah would need to reduce portions or substitute lower-GL alternatives to meet her target.
Total GL: Sum of GL values for all foods in a meal
Diabetes Management: Controlling blood glucose through dietary choices
Therapeutic Targets: Specific GL values for health conditions
• Calculate GL for each food item separately
• Sum individual GLs for total meal GL
• Compare to therapeutic targets
• Calculate each food's GL before combining
• Substitute high-GL foods with low-GL alternatives
• Balance high and low GI foods strategically
• Not scaling carbohydrate content to actual portions
• Forgetting to sum individual GLs for total meal GL
John regularly eats a breakfast of 1 slice of white bread (GI=75, carbs=15g) with 1 banana (GI=51, carbs=23g). His doctor recommends reducing his morning GL to under 15. If he replaces the white bread with steel-cut oats (GI=42, carbs=12g per 40g serving), what GL will he achieve, and what is the percent reduction?
Current breakfast (white bread + banana):
White bread GL = (75 × 15) ÷ 100 = 11.25
Banana GL = (51 × 23) ÷ 100 = 11.73
Current total GL = 11.25 + 11.73 = 22.98
New breakfast (steel-cut oats + banana):
Oats GL = (42 × 12) ÷ 100 = 5.04
Banana GL = 11.73 (unchanged)
New total GL = 5.04 + 11.73 = 16.77
Percent reduction = ((22.98 - 16.77) ÷ 22.98) × 100 = 27.0%
John achieves a GL of 16.77, which is still slightly above his target of <15, but represents a 27% reduction.
This example shows how strategic food substitutions can significantly reduce GL. While John's substitution achieved substantial improvement, he may need additional changes to meet his target. This demonstrates the importance of understanding both GI and portion effects.
Food Substitution: Replacing high-GL foods with low-GL alternatives
Percent Reduction: ((Old - New) ÷ Old) × 100
Therapeutic Dietary Changes: Modifications to meet health targets
• Replace high-GI foods with low-GI alternatives
• Calculate new GL after substitution
• Verify target achievement after changes
• Focus on highest-GL components first
• Combine substitutions for maximum effect
• Verify calculations to ensure target achievement
• Not verifying if new GL meets target
• Forgetting to recalculate entire meal after substitution
Which of the following statements about Glycemic Load is FALSE?
The answer is B) A GL of 25 is considered low. Actually, a GL of 25 is considered high. The GL categories are: Low (≤10), Moderate (11-19), and High (≥20). A GL of 25 would be significantly high and would cause a substantial blood sugar response.
Understanding the GL categories is crucial for practical application. The GL scale provides concrete targets for meal planning, especially for individuals managing diabetes or trying to control blood sugar levels. The categories help translate scientific measurements into actionable dietary guidance.
GL Categories: Low (≤10), Moderate (11-19), High (≥20)
Clinical Significance: Practical relevance for health management
Therapeutic Dietary Guidance: Evidence-based recommendations
• Low GL = ≤10
• Moderate GL = 11-19
• High GL = ≥20
• Remember: Low ≤10, Moderate 11-19, High ≥20
• Aim for low-moderate GL meals for diabetes
• Combine foods to achieve target GL
• Thinking higher GL values are better
• Not knowing the therapeutic targets
FAQ
Q: What is the difference between Glycemic Index and Glycemic Load, and which is more important for diabetes management?
A: The Glycemic Index (GI) measures how quickly a food raises blood glucose compared to pure glucose, while Glycemic Load (GL) incorporates both the GI and the amount of carbohydrates in a typical serving. GL is calculated as: \( \text{GL} = \frac{\text{GI} \times \text{Available Carbs (g)}}{100} \)
For diabetes management, GL is generally more practical because it accounts for portion size. A food with high GI but low carbohydrate content (like watermelon) can have a low GL, while a moderate GI food eaten in large portions can have a high GL. For diabetics, keeping meal GL under 10-15 is often recommended.
Q: Can following a low GL diet help with weight loss?
A: Yes, low GL diets can support weight loss through several mechanisms:
- Stable blood sugar: Prevents spikes and crashes that trigger hunger
- Increased satiety: Low GL foods tend to be more filling
- Reduced insulin response: Lower insulin promotes fat burning
- Better appetite control: Helps manage cravings
Research suggests that keeping daily GL under 80 can support weight management goals. The key is focusing on whole, minimally processed foods with low to moderate GL values.