BMI Calculator
Body mass index assessment • Health indicator • 2026 edition
BMI Formula:
Show the calculator\( \text{BMI} = \frac{\text{Weight (kg)}}{\text{Height (m)}^2} \)
Or for imperial units:
\( \text{BMI} = \frac{\text{Weight (lbs)} \times 703}{\text{Height (in)}^2} \)
Categories:
- Underweight: BMI < 18.5
- Normal weight: 18.5 ≤ BMI < 25
- Overweight: 25 ≤ BMI < 30
- Obesity: BMI ≥ 30
This formula calculates body mass index, a measure of body fat based on height and weight. It's widely used to screen for weight categories that may lead to health problems.
Example: For a person weighing 70 kg and 1.75 m tall:
BMI = 70 ÷ (1.75)² = 70 ÷ 3.0625 = 22.9 (Normal weight)
Personal Information
Body Measurements
Advanced Options
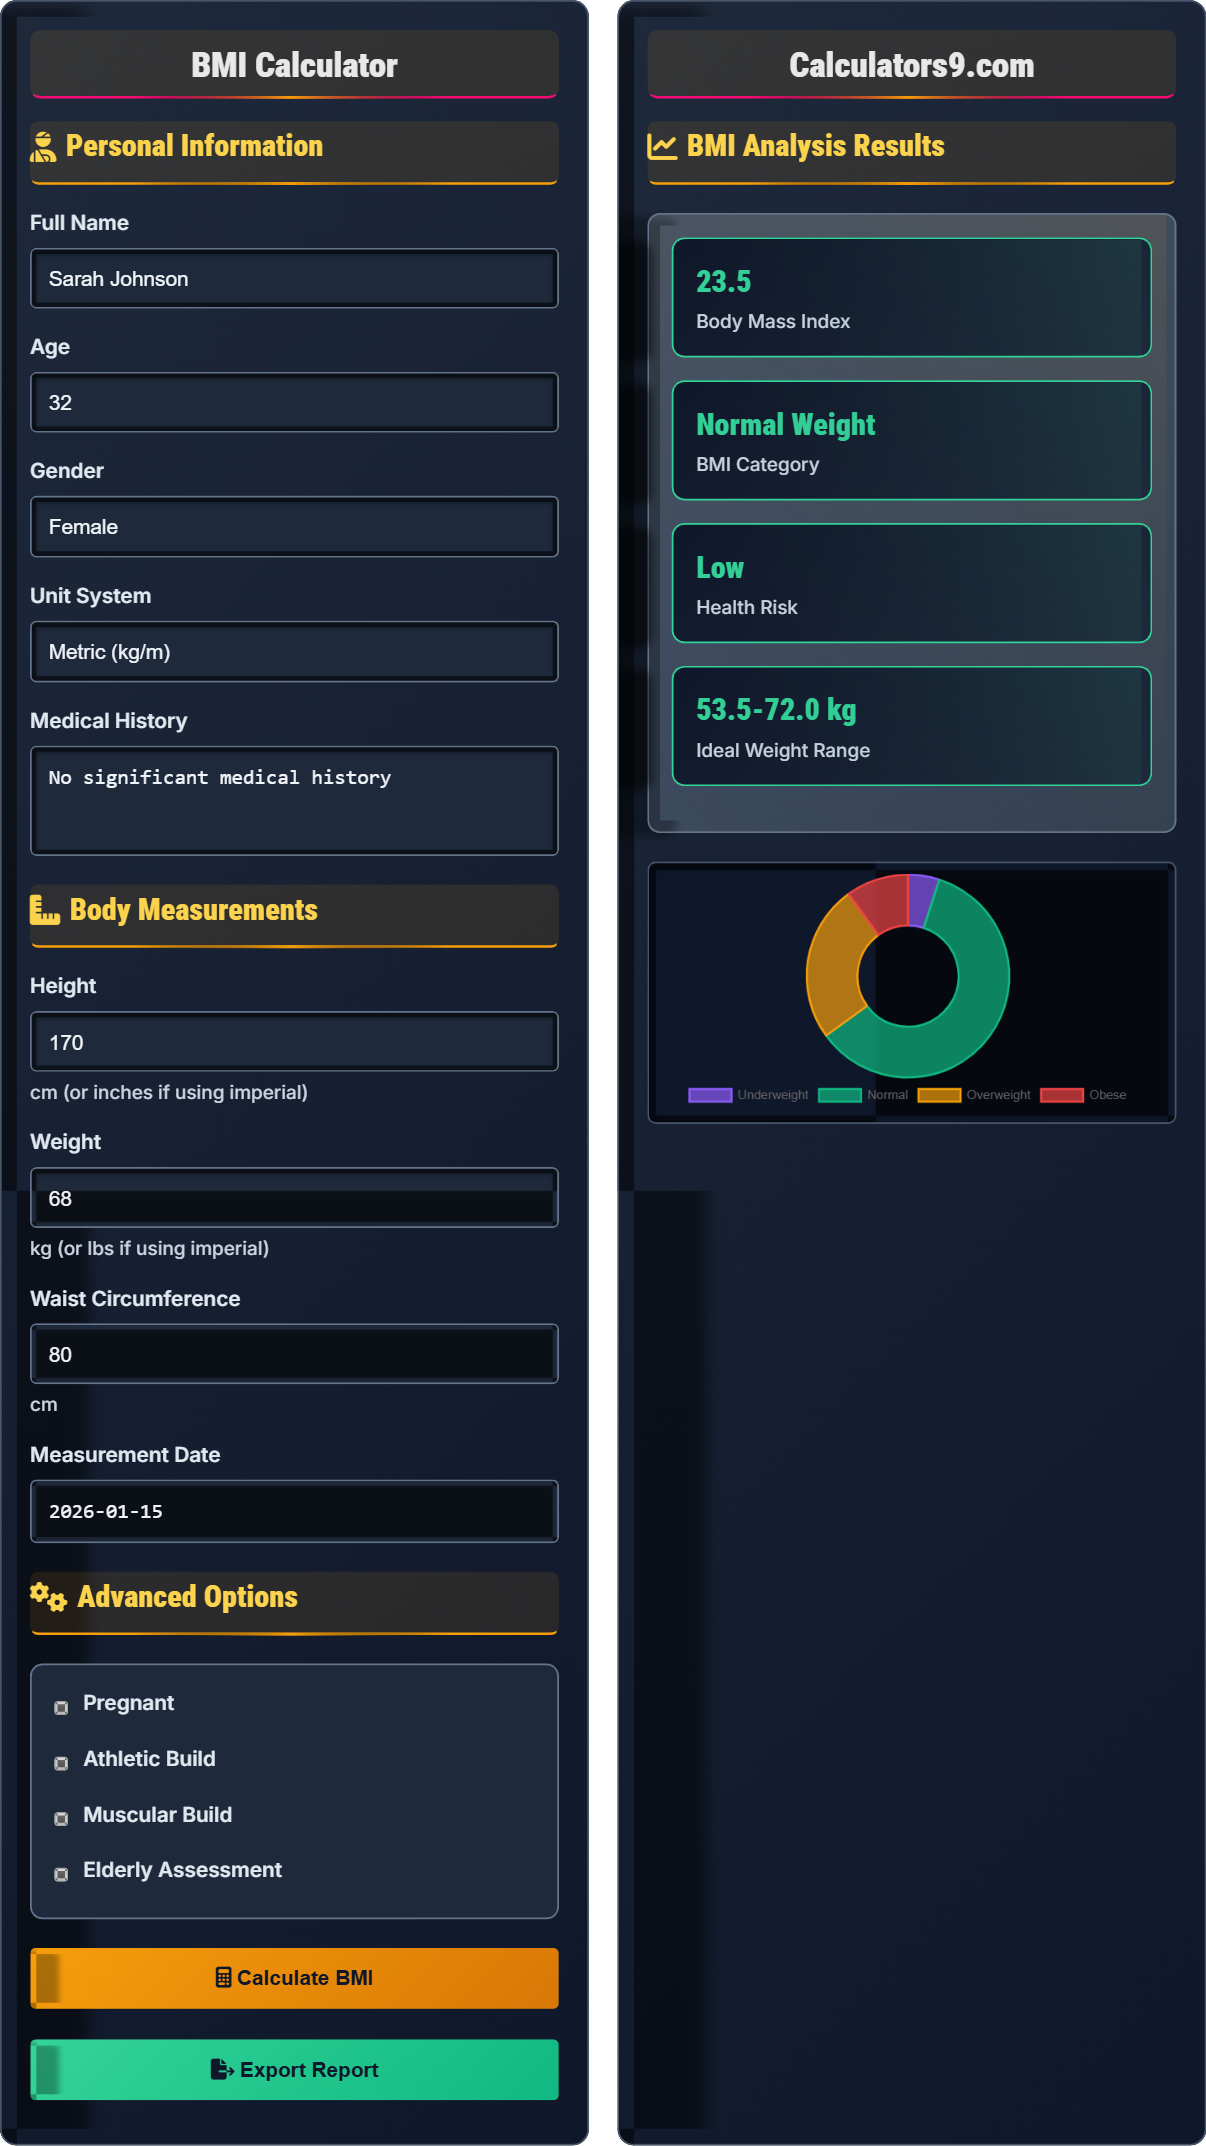
BMI Analysis Results
| Measurement | Value | Normal Range | Status |
|---|---|---|---|
| BMI | 23.5 | 18.5-24.9 | Normal |
| Weight | 68.0 kg | 55.0-70.0 kg | Healthy |
| Waist Circumference | 80 cm | <80 cm (F), <94 cm (M) | Good |
| BMI Percentile | 50th percentile | 5th-85th | Average |
| Recommendation | Implementation | Timeline | Priority |
|---|---|---|---|
| Maintain Current Weight | Continue healthy habits | Ongoing | High |
| Regular Exercise | 150 min/week moderate activity | Immediate | High |
| Balanced Nutrition | 5 portions fruits/vegetables daily | Ongoing | Medium |
| Annual Checkups | Regular health screenings | Yearly | Medium |
Comprehensive BMI Guide
Body Mass Index (BMI) is a simple index of weight-for-height that is commonly used to classify underweight, overweight, and obesity in adults. It was developed by Belgian statistician Adolphe Quetelet in the 1830s.
The standard BMI calculation uses the following formula:
For imperial units:
While BMI is widely used, it has important limitations:
- Muscle vs. Fat: Doesn't distinguish between muscle and fat mass
- Body Composition: Athletes may have high BMI despite low body fat
- Age: May not accurately reflect health risks in elderly
- Ethnicity: Different populations may have different risk thresholds
- Distribution: Doesn't account for fat distribution (visceral vs. subcutaneous)
- Underweight: Osteoporosis, immune problems, fertility issues
- Overweight: Type 2 diabetes, heart disease, stroke, sleep apnea
- Obesity: All above plus certain cancers, joint problems, depression
- Normal Weight: Lowest risk of weight-related health problems
- Weight Management: Even modest weight loss (5-10%) can improve health
BMI Knowledge Quiz
According to WHO standards, which BMI range is considered "Normal Weight" for adults?
The answer is B) 18.5-24.9. According to World Health Organization standards, adults with a BMI between 18.5 and 24.9 are classified as having a normal weight. This range is associated with the lowest risk of weight-related health problems.
The BMI categories provide a standardized way to assess weight status across populations. The normal range of 18.5-24.9 is based on extensive research showing that this range is associated with the lowest mortality rates and health risks. Understanding these categories helps individuals assess their health status and risk levels.
BMI: Body Mass Index, weight-to-height ratio
WHO: World Health Organization standards
Normal Weight: BMI range with lowest health risks
• Normal weight: 18.5-24.9
• Underweight: <18.5
• Overweight: 25.0-29.9
• Remember: 18.5 to 24.9 is ideal
• Slight variations may apply by ethnicity
• Consider other health indicators too
• Confusing ranges between categories
• Not knowing the standard ranges
• Thinking BMI is the only health indicator
Calculate the BMI for a person who is 1.75 meters tall and weighs 70 kilograms. Show your work using the BMI formula.
Step 1: Write the BMI formula
- BMI = Weight (kg) ÷ Height (m)²
Step 2: Substitute the given values
- Weight = 70 kg
- Height = 1.75 m
Step 3: Calculate height squared
- Height² = 1.75² = 3.0625 m²
Step 4: Calculate BMI
- BMI = 70 ÷ 3.0625 = 22.86
Step 5: Interpret the result
- BMI of 22.86 falls in the "Normal Weight" category (18.5-24.9)
Therefore, this person has a BMI of 22.9, which indicates normal weight.
This calculation demonstrates the basic BMI formula and its application. The result of 22.9 is in the normal range, indicating a healthy weight for this height. The calculation requires squaring the height in meters before dividing the weight by that value.
Body Mass Index: Weight-to-height ratio used to assess health
Height Squared: Height value multiplied by itself
Normal Weight: BMI range associated with lowest health risks
• Always square the height first
• Use meters for height in metric calculation
• Use kilograms for weight in metric calculation
• Convert units if needed
• Use calculator for precision
• Round to 1 decimal place
• Forgetting to square the height
• Dividing height by weight instead of reverse
A professional athlete is 1.80m tall and weighs 85kg, giving a BMI of 26.2 (overweight category). However, the athlete has very low body fat and high muscle mass. Explain why BMI may not accurately reflect the athlete's health status.
Step 1: Calculate the athlete's BMI
- BMI = 85 ÷ (1.80)² = 85 ÷ 3.24 = 26.2
Step 2: Identify the issue
- 26.2 BMI places the athlete in the "Overweight" category
- However, this classification doesn't consider body composition
Step 3: Explain BMI limitations
- BMI doesn't distinguish between muscle and fat mass
- Muscle is denser than fat and weighs more per volume
- Athletes often have high muscle mass, increasing their weight
Step 4: Alternative assessments
- Body fat percentage measurement
- Waist-to-hip ratio
- DEXA scan for body composition
Step 5: Conclusion
- For this athlete, BMI is misleading due to high muscle mass
- Other health indicators show excellent physical condition
Therefore, BMI may not accurately reflect the athlete's health status due to its inability to distinguish between lean muscle and fat mass.
This example demonstrates a key limitation of BMI: it doesn't account for body composition. Athletes often have BMIs in the overweight or obese range due to high muscle mass, even though they have low body fat and excellent health. This highlights the importance of using multiple health indicators rather than relying solely on BMI.
Body Composition: Proportions of fat, muscle, bone, and water in body
Lean Muscle Mass: Muscle tissue excluding fat
Density: Mass per unit volume of tissue
• BMI doesn't distinguish muscle from fat
• Athletes may have high BMI despite low fat
• Consider body composition for athletes
• Use additional measures for athletes
• Consider body fat percentage
• Waist circumference adds context
• Using BMI alone for athletic populations
• Not considering muscle mass in interpretation
• Ignoring other health indicators
A 45-year-old man has a BMI of 32 (obese category) and a waist circumference of 105cm. He also has a family history of diabetes and heart disease. Calculate the additional health risks associated with central obesity and explain the implications. (Hint: Consider waist circumference thresholds and combined risk factors)
Step 1: Analyze BMI status
- BMI = 32 (Obese category)
- Significantly increases risk of diabetes, heart disease, stroke
Step 2: Analyze waist circumference
- Waist = 105 cm
- Threshold for men: >94 cm indicates increased risk
- 105 cm exceeds threshold by 11 cm
Step 3: Calculate combined risk factors
- Obesity + Central obesity = Multiplicative risk
- Family history doubles genetic risk
- Age 45+ adds additional risk
Step 4: Quantify health risks
- Type 2 diabetes risk: 3-7x higher than normal weight
- Heart disease risk: 2-4x higher
- Stroke risk: 2-3x higher
- Central obesity adds 20-50% additional risk
Step 5: Health implications
- Urgent need for weight management
- Regular health monitoring required
- Medical supervision recommended
- Even 5-10% weight loss beneficial
This individual faces significantly elevated health risks and should seek medical guidance for weight management.
This example shows how BMI, waist circumference, and other risk factors combine to increase health risks. Central obesity (excess abdominal fat) is particularly dangerous as it's associated with visceral fat around organs. The combination of obesity, central adiposity, family history, and age creates a multiplicative risk profile requiring medical intervention.
Central Obesity: Excess fat around waist/abdomen
Visceral Fat: Fat surrounding internal organs
Multiplicative Risk: Combined factors increase risk more than sum of individual risks
• Men: >94cm waist = increased risk
• Women: >80cm waist = increased risk
• Combine multiple risk factors
• Measure waist at narrowest point
• Consider all risk factors together
• Even modest weight loss helps
• Only considering BMI without waist measurement
• Ignoring family history in risk assessment
• Not recognizing multiplicative risk effects
Which of the following populations is BMI LEAST accurate for assessing health risks?
The answer is D) All of the above. BMI is least accurate for all these populations because:
- Elderly: Muscle mass decreases with age, affecting BMI interpretation
- Athletes: High muscle mass increases BMI despite low body fat
- Pregnant: Normal weight gain during pregnancy affects BMI
Each population has unique characteristics that make BMI an inadequate sole indicator of health.
This question highlights that BMI is not universally applicable. Different populations have varying body compositions and health considerations that affect BMI interpretation. Healthcare providers must consider these limitations and use additional assessment tools when evaluating these special populations.
Special Populations: Groups with unique health considerations
Body Composition: Proportions of different body tissues
Health Assessment: Evaluating overall health status
• BMI not suitable for all populations
• Use additional measures for special groups
• Consider individual circumstances
• Use body composition for athletes
• Adjust for pregnancy changes
• Consider muscle loss in elderly
• Applying standard BMI ranges to all populations
• Not considering special circumstances
• Relying on BMI alone for health assessment
BMI Fundamentals
Body Mass Index is a measure of body fat based on height and weight that applies to adult men and women.
\( \text{BMI} = \frac{\text{Weight (kg)}}{\text{Height (m)}^2} \)
Where BMI values range from underweight to obesity categories.
- Normal range: 18.5-24.9
- Does not distinguish muscle from fat
- Consider other health indicators
Weight Management Strategies
Approaches to maintain, lose, or gain weight in a healthy manner based on BMI assessment.
- Set realistic goals (5-10% weight change)
- Focus on nutrition and physical activity
- Monitor progress regularly
- Seek professional guidance when needed
- Address underlying health conditions
- Individual health status
- Age and gender factors
- Medical conditions
- Sustainable lifestyle changes
FAQ
Q: How often should I calculate my BMI?
A: For most adults, calculate BMI annually during routine checkups. If actively managing weight, calculate monthly. For weight loss, BMI should be recalculated every 2-4 weeks to track progress.
Mathematical approach to monitoring frequency:
\( \text{Monitoring Frequency} = \frac{\text{Weight Management Intensity}}{\text{Stability Period}} \)
Higher weight management intensity requires more frequent monitoring.
Q: What if my BMI is normal but I still feel unhealthy?
A: BMI is just one health indicator. Other factors like body composition, fitness level, blood markers, and overall well-being matter too. Consider:
- Body fat percentage
- Waist circumference
- Blood pressure and cholesterol
- Energy levels and mood
- Physical fitness test results
If concerns persist, consult a healthcare provider for comprehensive assessment.