Cholesterol Ratio Calculator
Lipid profile analysis • Cardiovascular risk • 2026 edition
Cholesterol Ratio Formula:
Show the calculator\( \text{Cholesterol Ratio} = \frac{\text{Total Cholesterol}}{\text{HDL Cholesterol}} \)
Additional important ratios:
- \( \text{LDL/HDL Ratio} = \frac{\text{LDL Cholesterol}}{\text{HDL Cholesterol}} \)
- \( \text{TC/HDL Ratio} = \frac{\text{Total Cholesterol}}{\text{HDL Cholesterol}} \)
- \( \text{Non-HDL Cholesterol} = \text{Total Cholesterol} - \text{HDL Cholesterol} \)
These ratios help assess cardiovascular disease risk. Lower ratios indicate better cardiovascular health. The TC/HDL ratio should be less than 4.0 for men and 3.5 for women.
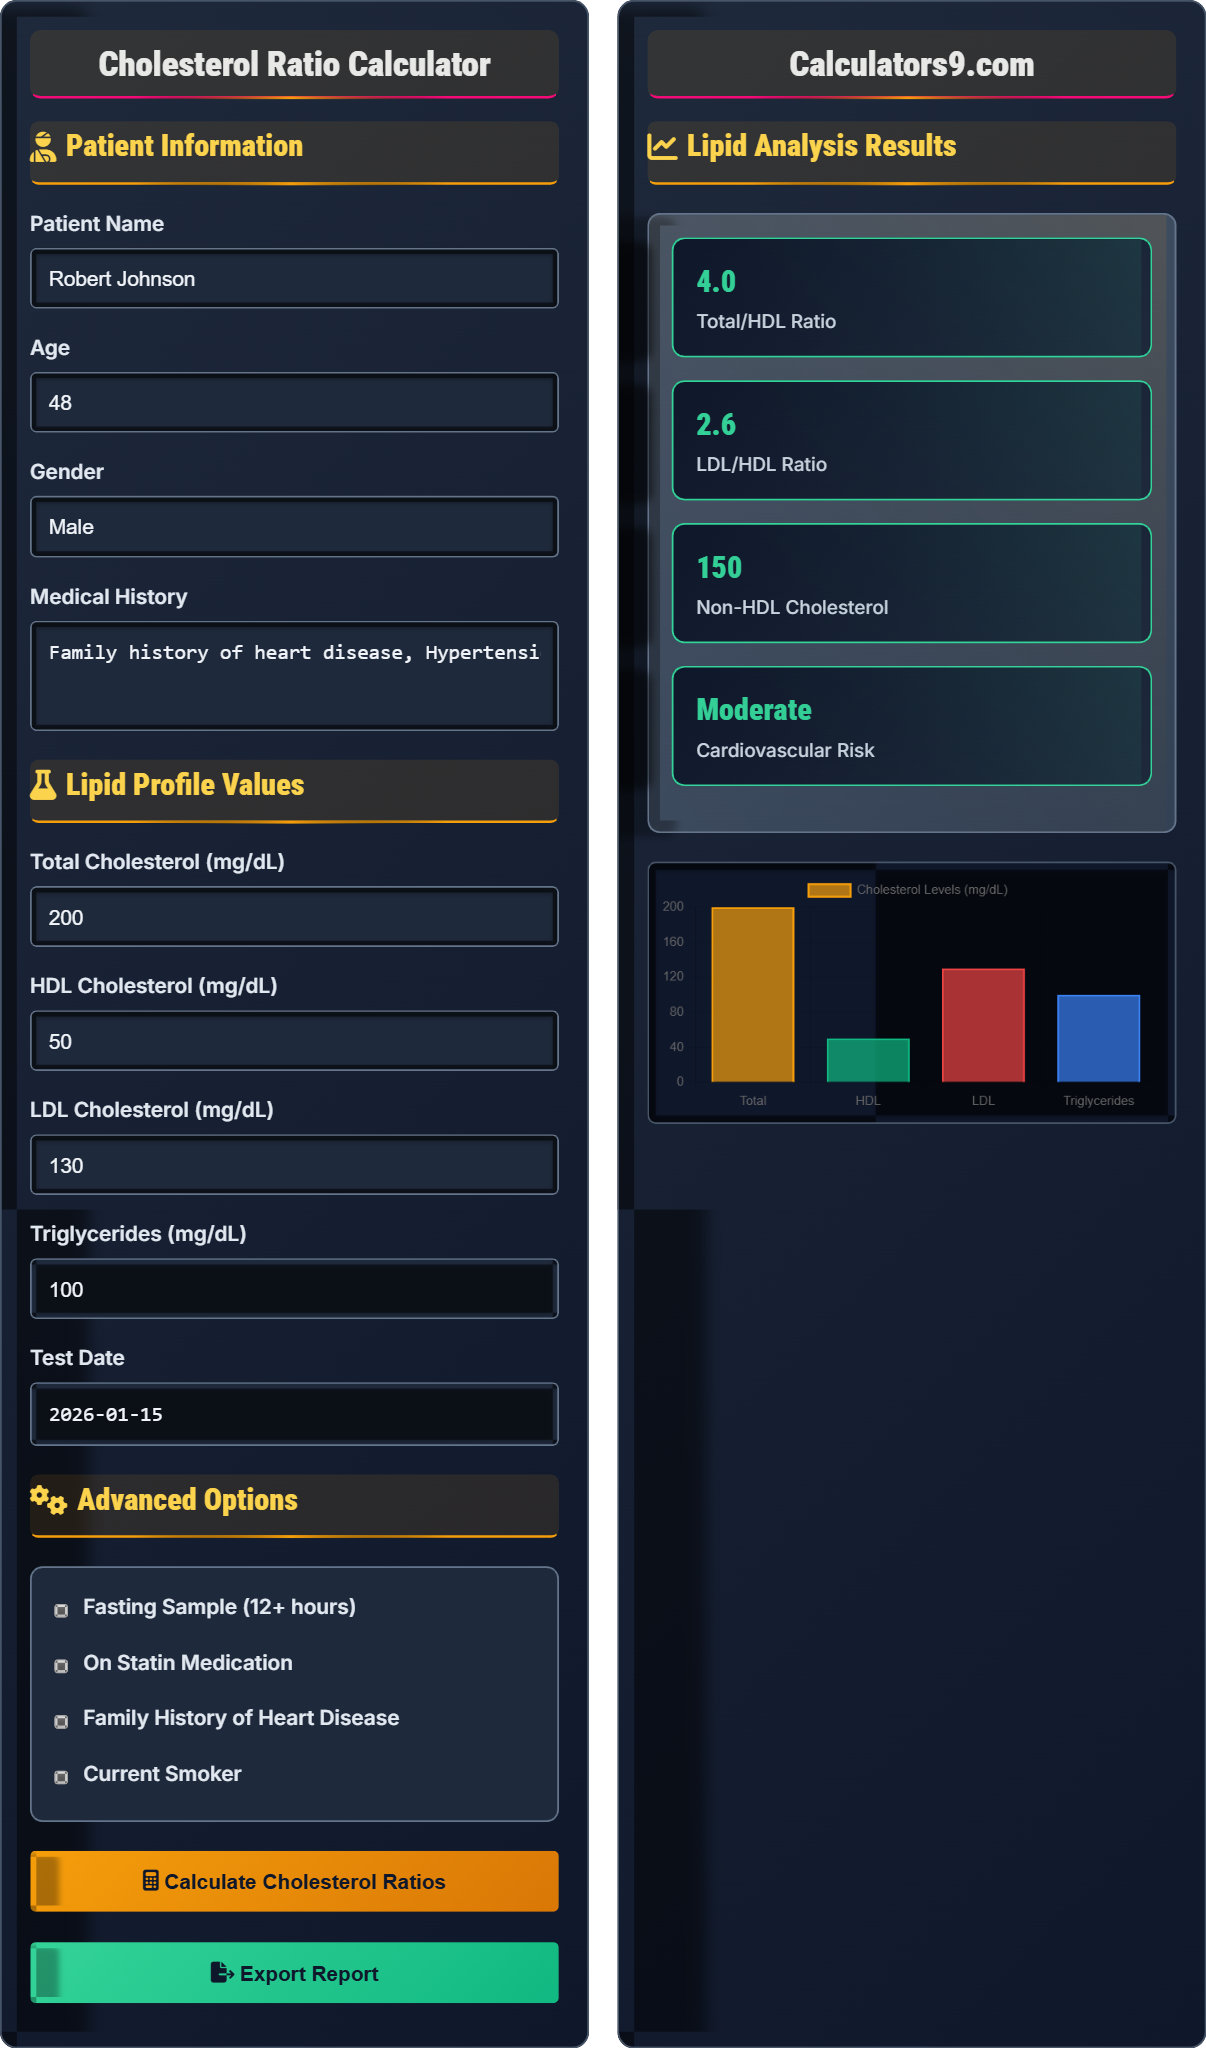
Example: For a patient with Total Cholesterol 200 mg/dL and HDL 50 mg/dL:
TC/HDL Ratio = 200 ÷ 50 = 4.0 (Borderline high risk)
LDL would be 130 mg/dL (calculated as Total - HDL - Triglycerides/5), giving an LDL/HDL ratio of 2.6.
Patient Information
Lipid Profile Values
Advanced Options
Lipid Analysis Results
| Ratio/Value | Result | Target | Status |
|---|---|---|---|
| Total/HDL Ratio | 4.0 | <4.0 (M), <3.5 (F) | Borderline |
| LDL/HDL Ratio | 2.6 | <3.0 | Good |
| Non-HDL | 150 mg/dL | <130 mg/dL | Elevated |
| HDL Level | 50 mg/dL | >40 (M), >50 (F) | Normal |
| Recommendation | Implementation | Impact | Priority |
|---|---|---|---|
| Increase Physical Activity | 30 min/day, 5 days/week | +5% HDL, -10% LDL | High |
| Dietary Modifications | Reduce saturated fats | -15% Total Cholesterol | High |
| Weight Management | Lose 5-10% body weight | +10% HDL, -20% Triglycerides | Medium |
| Medication Review | Consult physician | -25% LDL | Medium |
Comprehensive Cholesterol Guide
Cholesterol ratios provide a more comprehensive assessment of cardiovascular risk than individual lipid values alone. The Total Cholesterol to HDL ratio is a key indicator of heart disease risk, with lower ratios indicating better cardiovascular health.
Important cholesterol calculations:
Target cholesterol values differ by gender:
- Total Cholesterol: <200 mg/dL for both genders
- HDL (Men): >40 mg/dL
- HDL (Women): >50 mg/dL
- LDL: <100 mg/dL (optimal), <130 mg/dL (near optimal)
- Triglycerides: <150 mg/dL
- Diet: Increase omega-3 fatty acids, fiber, and plant sterols
- Exercise: Regular aerobic activity increases HDL
- Weight Loss: Reduces total cholesterol and triglycerides
- Smoking Cessation: Increases HDL levels
- Medications: Statins, fibrates, and other lipid-lowering drugs
Cholesterol Knowledge Quiz
Which of the following TC/HDL ratios indicates the highest cardiovascular risk?
The answer is C) 5.2. Higher TC/HDL ratios indicate greater cardiovascular risk. A ratio of 5.2 is significantly above the threshold of 5.0, which indicates high risk. The lower the ratio, the better the cardiovascular health.
Cholesterol ratios provide a more comprehensive assessment than individual values. The TC/HDL ratio combines information about both "bad" and "good" cholesterol into a single metric. A high ratio means you have proportionally more total cholesterol relative to protective HDL cholesterol, which increases cardiovascular risk.
TC/HDL Ratio: Total cholesterol divided by HDL cholesterol
Cardiovascular Risk: Likelihood of heart disease
HDL Cholesterol: "Good" cholesterol that protects against heart disease
• Lower ratios indicate better health
• Ratio >5.0 = High risk
• Ratio <4.0 = Low risk
• Remember: Lower is better
• Aim for ratio below 4.0
• Improve HDL to lower ratio
• Confusing TC/HDL with LDL/HDL
• Thinking higher ratios are better
• Ignoring HDL in risk assessment
Calculate the TC/HDL ratio for a patient with Total Cholesterol of 220 mg/dL and HDL of 44 mg/dL. Also calculate the LDL/HDL ratio if LDL is 140 mg/dL. Show your work.
Step 1: Calculate TC/HDL ratio
- TC/HDL = Total Cholesterol ÷ HDL
- TC/HDL = 220 ÷ 44 = 5.0
Step 2: Calculate LDL/HDL ratio
- LDL/HDL = LDL ÷ HDL
- LDL/HDL = 140 ÷ 44 = 3.18
Step 3: Interpret results
- TC/HDL ratio of 5.0 is at the high-risk threshold
- LDL/HDL ratio of 3.18 is slightly elevated
Therefore, this patient has a TC/HDL ratio of 5.0 and an LDL/HDL ratio of 3.18, indicating elevated cardiovascular risk.
This calculation demonstrates how to derive important risk ratios from basic lipid panel values. The TC/HDL ratio of 5.0 places this patient at the high-risk threshold, while the LDL/HDL ratio of 3.18 indicates elevated risk. These values together provide a comprehensive risk assessment.
Total Cholesterol: Sum of all cholesterol types
HDL Cholesterol: High-density lipoprotein, "good" cholesterol
LDL Cholesterol: Low-density lipoprotein, "bad" cholesterol
• Always divide total by HDL
• Round ratios to one decimal place
• Compare to established thresholds
• Use calculator for precise division
• Compare to gender-specific targets
• Consider multiple ratios together
• Dividing HDL by Total instead of reverse
• Using incorrect units
• Not interpreting clinical significance
Sarah, a 45-year-old woman, has a TC/HDL ratio of 3.8 and an LDL of 120 mg/dL. Her father had a heart attack at age 52. How would you interpret her risk and what recommendations would you make?
Step 1: Analyze the ratios
- TC/HDL ratio = 3.8 (optimal for women, as target is <3.5)
- LDL = 120 mg/dL (near optimal, target <100 mg/dL)
Step 2: Consider family history
- Father's early heart attack (age 52) = significant risk factor
- Family history increases overall cardiovascular risk
Step 3: Risk assessment
- Cholesterol ratios suggest low-moderate risk
- Family history increases risk category
- Overall risk is moderate
Step 4: Recommendations
- Continue healthy lifestyle habits
- Regular monitoring (every 6-12 months)
- Consider genetic testing for familial hypercholesterolemia
- Discuss statin therapy with physician
Despite favorable ratios, family history warrants careful monitoring and possible intervention.
This example demonstrates that cholesterol ratios are just one component of cardiovascular risk assessment. Family history is a powerful risk factor that can elevate risk even when lipid values appear favorable. Clinical decision-making requires integrating multiple risk factors.
Family History: Genetic predisposition to heart disease
Cardiovascular Risk: Combined probability of heart events
Risk Stratification: Categorizing patients by risk level
• Consider multiple risk factors
• Family history is unmodifiable risk
• Cholesterol is modifiable risk
• Use Framingham risk calculator
• Consider lifetime risk
• Evaluate risk factor clustering
• Ignoring family history in risk assessment
• Over-relying on lipid values alone
• Not considering gender differences
Mark started statin therapy 3 months ago. His initial TC/HDL ratio was 4.8 (Total 210, HDL 44). His recent values show Total 180 and HDL 48. Calculate the change in his ratio and assess the treatment effectiveness. (Hint: Consider both absolute change and clinical significance)
Step 1: Calculate initial ratio
- Initial TC/HDL = 210 ÷ 44 = 4.77 ≈ 4.8
Step 2: Calculate current ratio
- Current TC/HDL = 180 ÷ 48 = 3.75 ≈ 3.8
Step 3: Calculate change
- Change = 4.8 - 3.8 = 1.0 improvement
- Percent improvement = (4.8 - 3.8) ÷ 4.8 × 100 = 20.8%
Step 4: Assess clinical significance
- Initial ratio of 4.8 = borderline high risk
- Current ratio of 3.8 = optimal risk
- Significant improvement in cardiovascular risk
Step 5: Conclusion
- Statin therapy has been highly effective
- 20.8% improvement in TC/HDL ratio
- Risk category improved from borderline to optimal
This demonstrates excellent response to statin therapy with significant cardiovascular risk reduction.
This example shows how to quantify treatment effectiveness using cholesterol ratios. The 20.8% improvement represents a substantial reduction in cardiovascular risk. The patient moved from a borderline high-risk category to an optimal category, demonstrating the clinical significance of the change.
Statin Therapy: Medication to lower cholesterol
Treatment Response: Change in values after intervention
Clinical Significance: Meaningful change in health outcomes
• Compare before and after values
• Calculate percent improvement
• Assess clinical significance
• Monitor ratios over time
• Look for 10%+ improvements
• Consider combined lipid changes
• Only looking at absolute values
• Not considering baseline risk
• Ignoring clinical context
Why do women typically have more favorable cholesterol ratios than men?
The answer is B) Estrogen increases HDL levels. Estrogen has a beneficial effect on lipid metabolism, particularly by increasing HDL ("good") cholesterol levels. This hormonal advantage typically persists until menopause, when HDL levels tend to decrease.
Gender differences in cholesterol metabolism are primarily due to hormonal effects. Estrogen has cardioprotective properties, including raising HDL cholesterol and improving the TC/HDL ratio. This explains why women typically have more favorable lipid profiles than men before menopause.
Estrogen: Female sex hormone with lipid effects
Hormonal Effects: Influence of hormones on metabolism
Cardioprotective: Protective against heart disease
• Women: TC/HDL target <3.5
• Men: TC/HDL target <4.0
• Hormones affect lipid profiles
• Consider menopause in women's lipid management
• Gender-specific targets apply
• Hormone replacement may affect lipids
• Not accounting for gender differences
• Using same targets for all patients
• Ignoring hormonal influences
Cholesterol Fundamentals
Waxy substance found in cells and used to make hormones, vitamin D, and bile acids for digestion. Essential but problematic in excess.
\( \text{TC/HDL Ratio} = \frac{\text{Total Cholesterol}}{\text{HDL Cholesterol}} \)
\( \text{Non-HDL} = \text{Total Cholesterol} - \text{HDL Cholesterol} \)
Lower ratios indicate better cardiovascular health.
- TC/HDL < 4.0 (men), < 3.5 (women) = optimal
- Higher HDL is better
- Lower LDL is better
Lipid Management Strategies
Approaches to optimize lipid profiles and reduce cardiovascular risk.
- Dietary modifications (reduce saturated fats)
- Regular physical activity
- Weight management
- Medication when indicated
- Regular monitoring
- Individual risk factors
- Family history
- Age and gender
- Overall health status
FAQ
Q: How often should I get my cholesterol checked?
A: For adults without risk factors, check every 4-6 years. If you have risk factors (family history, diabetes, hypertension) or are on medication, check annually or as directed by your physician. Those with high cholesterol should monitor every 3-6 months initially.
Mathematical approach to monitoring frequency:
\( \text{Monitoring Frequency} = \frac{\text{Risk Level} \times \text{Treatment Status}}{\text{Stability Factor}} \)
Higher risk and treatment status increase monitoring frequency.
Q: What lifestyle changes can improve cholesterol ratios?
A: Effective lifestyle changes include:
- Omega-3 rich foods (salmon, walnuts, flaxseed)
- Soluble fiber (oats, beans, apples)
- Regular aerobic exercise (30 min/day)
- Weight loss (even 5-10% helps)
- Limit saturated and trans fats
These changes can improve TC/HDL ratios by 10-20% in 6-12 weeks.