Symptom Tracker
Health monitoring • Pattern analysis • 2026 edition
Symptom Severity Index:
Show the calculator\( \text{SSI} = \left( \frac{\sum(\text{Symptom Severity})}{\text{Number of Symptoms}} \right) \times \text{Duration Factor} \times \text{Impact Factor} \)
Where:
- Symptom Severity = Individual severity ratings (1-10 scale)
- Duration Factor = Adjusts for symptom persistence
- Impact Factor = Adjusts for quality of life impact
This formula calculates the Symptom Severity Index, providing a quantitative measure of overall symptom burden. Higher SSI values indicate greater symptom impact requiring medical attention.
Example: For 3 symptoms with severities 7, 5, and 8 over 2 weeks:
Average Severity = (7+5+8)/3 = 6.67
Duration Factor (2 weeks) = 1.2, Impact Factor = 1.1
SSI = 6.67 × 1.2 × 1.1 = 8.8 (High severity requiring medical attention)
Patient Information
Symptom Input
Advanced Options
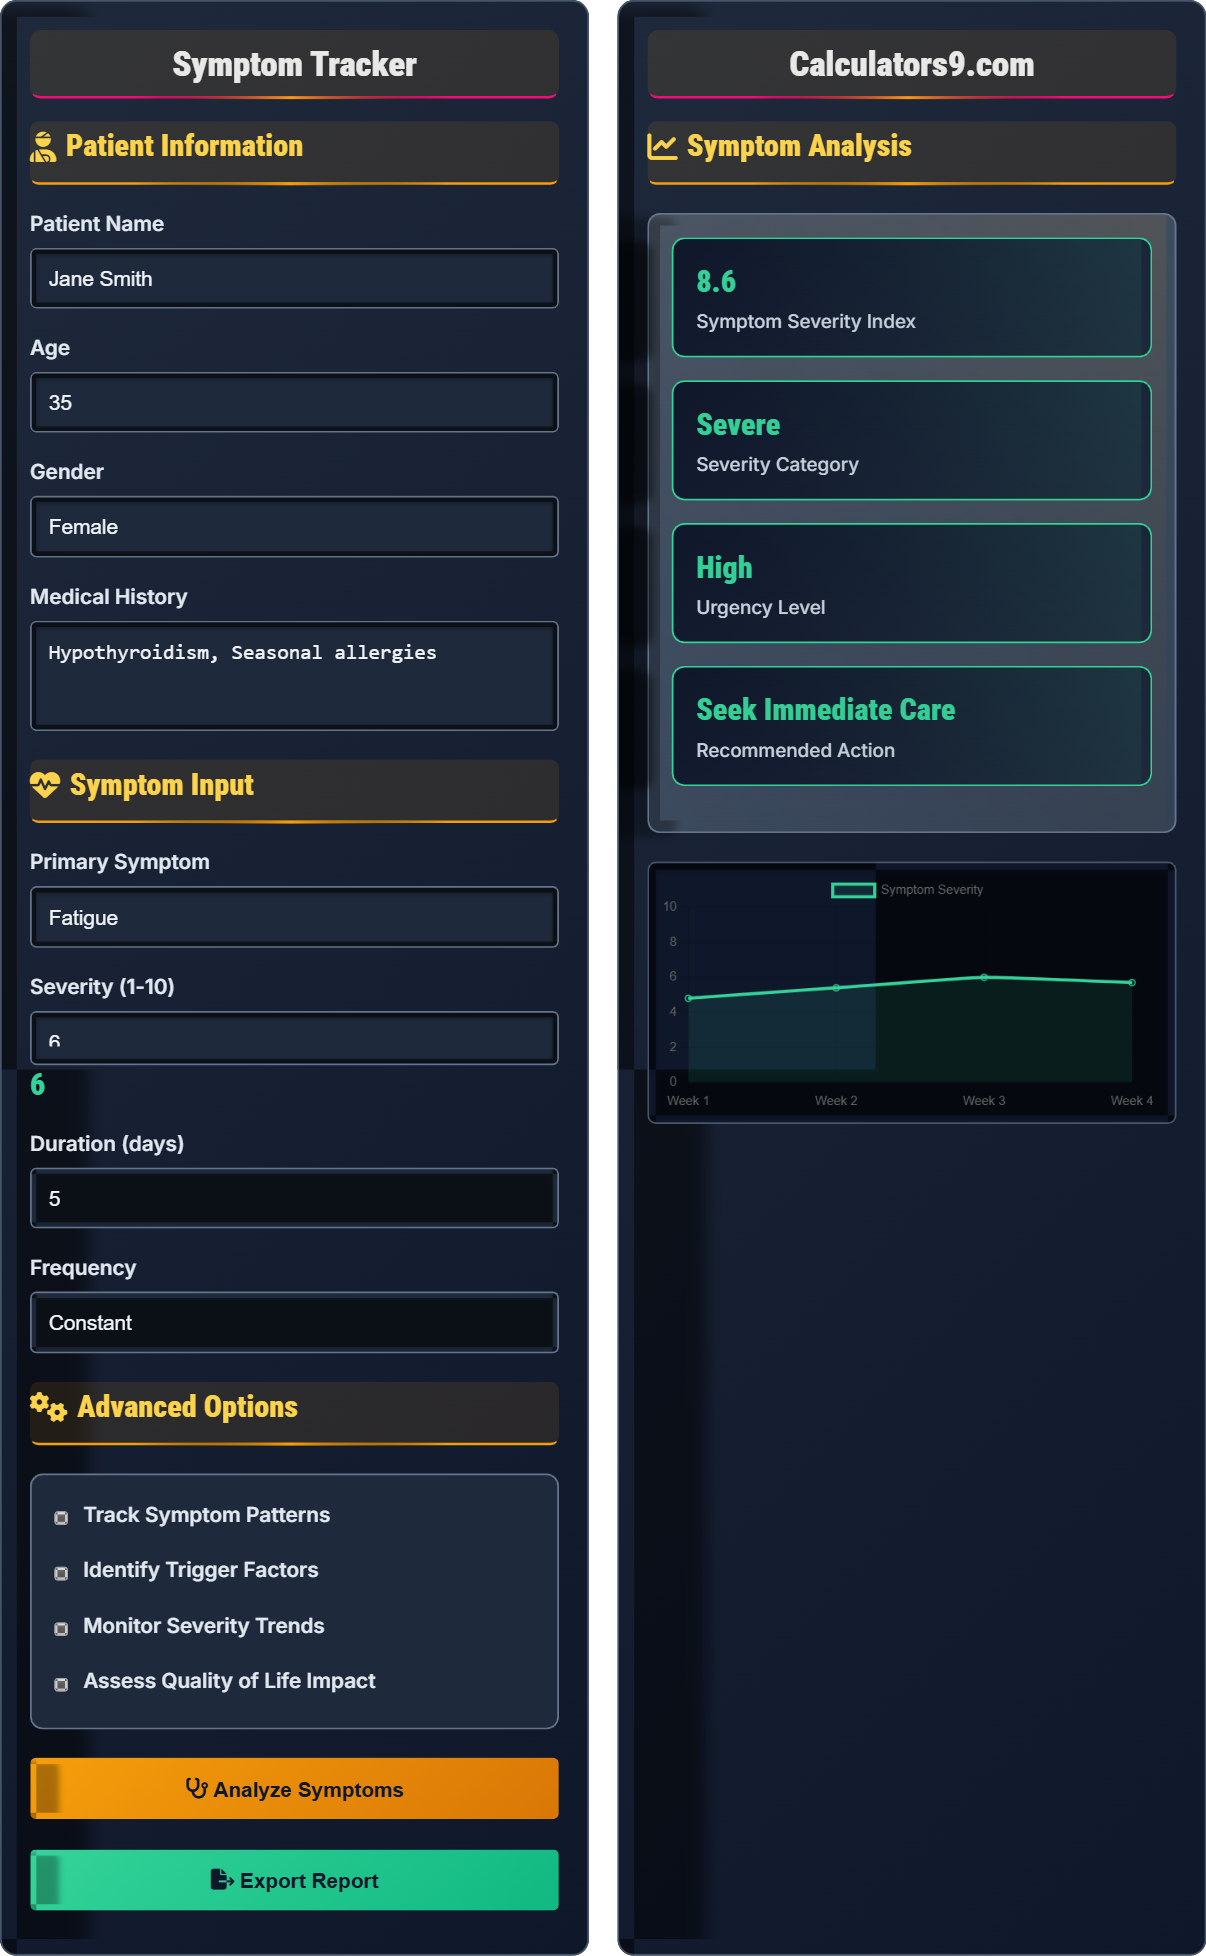
Symptom Analysis
| Symptom | Severity | Duration | Frequency |
|---|---|---|---|
| Fatigue | 6/10 | 5 days | Daily |
| Headache | 5/10 | 3 days | Frequent |
| Joint Pain | 7/10 | 4 days | Daily |
| Day | Severity | Pattern | Notes |
|---|---|---|---|
| Day 1 | 4/10 | Mild | Started after stress |
| Day 2 | 5/10 | Increasing | Worse in evening |
| Day 3 | 6/10 | Peaking | Rest helps |
| Day 4 | 6/10 | Stable | No change |
| Day 5 | 6/10 | Stable | Continue monitoring |
Comprehensive Symptom Tracking Guide
Symptom tracking is the systematic recording and monitoring of physical and emotional symptoms over time. It helps identify patterns, triggers, and the effectiveness of treatments, enabling better healthcare decisions and communication with medical professionals.
The Symptom Severity Index calculation uses the following formula:
Where:
- Symptom Severity = Individual severity ratings (1-10 scale)
- Duration Factor = Adjusts for symptom persistence
- Impact Factor = Adjusts for quality of life impact
Effective symptom tracking provides numerous benefits:
- Pattern Recognition: Identifying triggers and trends
- Treatment Evaluation: Assessing medication effectiveness
- Communication: Providing detailed information to healthcare providers
- Early Detection: Recognizing symptom escalation
- Self-Management: Empowering patients to manage their health
- Consistency: Record symptoms at the same time daily
- Objectivity: Use standardized scales for severity
- Detail: Note triggers, duration, and associated factors
- Technology: Use apps or digital tools for accuracy
- Review: Regularly analyze collected data
Symptom Tracking Quiz
Which of the following best describes the purpose of a Symptom Severity Index?
The answer is B) To quantify symptom burden for medical communication. The Symptom Severity Index is a tool to standardize and communicate symptom severity to healthcare providers, not to replace medical diagnosis or eliminate professional care.
Symptom tracking tools serve as communication aids between patients and healthcare providers. They help standardize subjective experiences into quantifiable data that can inform clinical decisions. The index is not diagnostic but supportive of the diagnostic process.
Symptom Severity Index: Quantitative measure of symptom burden
Symptom Burden: Overall impact of symptoms on health
Quantifiable Data: Measurable information for analysis
• Symptom tracking supports, not replaces, medical care
• Professional diagnosis is still required
• Quantification helps with communication
• Use consistent rating scales
• Record symptoms regularly
• Share data with healthcare providers
• Using tracking as substitute for medical care
• Inconsistent recording practices
• Not sharing data with doctors
Calculate the Symptom Severity Index for a patient experiencing 3 symptoms with severities of 7, 5, and 8 over 10 days. Apply a duration factor of 1.3 (for 10 days) and an impact factor of 1.1. Show your work.
Step 1: Calculate average symptom severity
- (7 + 5 + 8) ÷ 3 = 20 ÷ 3 = 6.67
Step 2: Apply the formula
- SSI = Average Severity × Duration Factor × Impact Factor
- SSI = 6.67 × 1.3 × 1.1
- SSI = 6.67 × 1.43 = 9.54
Therefore, the Symptom Severity Index is 9.54, which falls in the "Severe" category requiring immediate medical attention.
This calculation demonstrates how multiple factors contribute to the overall severity index. The high index value (9.54) indicates severe symptoms that warrant immediate medical attention, even though individual symptom scores were moderate. This shows how the index amplifies concern when multiple symptoms occur together.
Symptom Severity Index: Composite measure of symptom burden
Duration Factor: Multiplier based on symptom persistence
Impact Factor: Multiplier based on quality of life effect
• Calculate average severity first
• Apply all factors in sequence
• Higher scores indicate greater concern
• Keep symptom logs updated daily
• Note all concurrent symptoms
• Track duration accurately
• Forgetting to calculate average severity
• Applying factors incorrectly
• Not tracking all concurrent symptoms
Sarah has been tracking her headaches for 2 weeks. She notices they occur primarily on weekdays, worsen during work meetings, and improve after she leaves the office. Her Symptom Severity Index is 6.8. What pattern is emerging, and what action should she consider?
Step 1: Identify the pattern
- Temporal pattern: Occurs on weekdays
- Contextual trigger: Worsens during work meetings
- Relief pattern: Improves after leaving office
Step 2: Interpret the findings
- Pattern suggests stress-related headaches
- Work environment may be contributing factor
- Stress from meetings appears to be trigger
Step 3: Recommended actions
- Discuss findings with healthcare provider
- Consider stress management techniques
- Evaluate workplace stressors
- Monitor if pattern continues
With an SSI of 6.8 (High category), Sarah should consult her doctor about these stress-related headache patterns.
This example demonstrates how pattern recognition in symptom tracking can reveal important insights about triggers and causes. By identifying that headaches correlate with work meetings, Sarah can take targeted steps to address the underlying stress. The SSI of 6.8 confirms that these headaches are significantly impacting her health.
Pattern Recognition: Identifying recurring symptom sequences
Trigger Factors: Conditions that initiate symptoms
Stress-Related Headaches: Tension headaches caused by stress
• Track timing and context of symptoms
• Look for consistent patterns
• Consider environmental factors
• Note time, location, and activities
• Track potential dietary triggers
• Monitor sleep and stress levels
• Not recording contextual details
• Missing subtle patterns
• Ignoring environmental factors
Mike has been tracking his joint pain for 3 weeks. Initially, his Symptom Severity Index was 4.2 (Medium). Over the past week, his index has risen to 7.8 (High), with pain now occurring daily instead of occasionally. What does this trend suggest, and what should be his next step? (Hint: Consider the significance of escalating symptoms)
Step 1: Analyze the trend
- Initial SSI: 4.2 (Medium) - 3 weeks ago
- Current SSI: 7.8 (High) - 1 week ago
- Change: +3.6 points (86% increase)
- Frequency: Increased from occasional to daily
Step 2: Interpret the significance
- Significant escalation in symptom severity
- Transition from manageable to concerning level
- Increased frequency indicates progression
- Potential underlying condition worsening
Step 3: Recommended next steps
- Contact healthcare provider immediately
- Share detailed symptom tracking data
- Request urgent appointment
- Continue daily monitoring until seen
This rapid escalation from Medium to High severity indicates a significant change requiring immediate medical evaluation.
This example highlights the importance of trend analysis in symptom tracking. The 86% increase in SSI over just one week represents a dramatic change that warrants immediate attention. Tracking tools are valuable for identifying these critical changes that might otherwise go unnoticed until symptoms become severe.
Trend Analysis: Examining changes in symptoms over time
Symptom Escalation: Increasing severity or frequency
Progression: Worsening of condition over time
• Monitor trends, not just current state
• Document all significant changes
Which of the following best represents the relationship between symptom severity and quality of life impact in the Symptom Severity Index?
The answer is B) Quality of life impact is factored through the Impact Factor. The Symptom Severity Index includes an Impact Factor specifically designed to account for how symptoms affect a patient's daily functioning and overall quality of life, which can vary significantly between individuals.
The Impact Factor acknowledges that two patients with the same symptom severity may experience vastly different effects on their lives. A teacher with mild anxiety may be significantly impacted during presentations, while someone in a solitary job may be less affected. The index accounts for these individual differences in impact.
Quality of Life Impact: Effect of symptoms on daily functioning
Impact Factor: Multiplier accounting for individual differences
Daily Functioning: Ability to perform routine activities
• Impact varies by individual and circumstance
• Same severity can have different impacts
• Consider functional limitations
• Note how symptoms affect daily tasks
• Track work and social limitations
• Consider emotional impact
• Underestimating functional impact
• Not considering individual differences
• Ignoring emotional effects
Symptom Tracking Fundamentals
Systematic recording of physical and emotional symptoms over time to identify patterns and inform medical care.
\( \text{SSI} = \left( \frac{\sum(\text{Symptom Severity})}{\text{Number of Symptoms}} \right) \times \text{Duration Factor} \times \text{Impact Factor} \)
Where SSI values above 6 indicate high severity requiring medical attention.
- Consistency is crucial for pattern recognition
- Objectivity improves accuracy
- Regular review helps identify trends
Tracking Enhancement Strategies
Methods to improve the accuracy and usefulness of symptom data collection.
- Use standardized severity scales
- Record symptoms at consistent times
- Include contextual information
- Track related factors (sleep, diet, stress)
- Regular data review and analysis
- Individual symptom variations
- Environmental factors
- Medication effects
- Emotional influences
FAQ
Q: How often should I record my symptoms for effective tracking?
A: For effective tracking, record symptoms at least once daily, preferably at the same time. If symptoms fluctuate significantly, consider multiple recordings per day. Consistent daily tracking over 2-4 weeks typically reveals meaningful patterns.
Mathematically, data reliability increases with frequency:
\( \text{Reliability} = \frac{\text{Recording Frequency}}{\text{Symptom Variability}} \)
More frequent recordings provide better insight into trends and triggers.
Q: What should I do if I notice my loved one's symptoms are getting worse?
A: Document the changes with specific details: when, how severe, duration, and any new symptoms. Contact the healthcare provider immediately if symptoms escalate rapidly or if the Symptom Severity Index increases by more than 2 points in a week.
- Record objective observations
- Note functional changes
- Track vital signs if possible
- Prepare symptom tracking data for medical review
Early intervention often prevents complications and improves outcomes.