Resting Heart Rate Trend Analyzer
Cardiac recovery • Fitness metrics
Resting Heart Rate: \( \text{RHR} = \text{Heart Beats in 60 seconds while at rest} \)
Trend Calculation: \( \text{Trend} = \frac{\text{Recent RHR} - \text{Baseline RHR}}{\text{Baseline RHR}} \times 100 \)
Recovery Index: \( \text{RI} = \text{RHR Trend} \times \text{Heart Rate Variability} \times \text{Fitness Factor} \)
Where:
- \( \text{Normal RHR: } 60-100 \text{ bpm} \)
- \( \text{Athletic RHR: } 40-60 \text{ bpm} \)
- \( \text{Baseline RHR: } \text{7-day average} \)
- \( \text{Heart Rate Variability: } \text{Variation in beat-to-beat intervals} \)
Healthy adults: 60-100 bpm. Athletes: 40-60 bpm. Decreasing RHR indicates improved fitness; increasing RHR may indicate stress, illness, or overtraining.
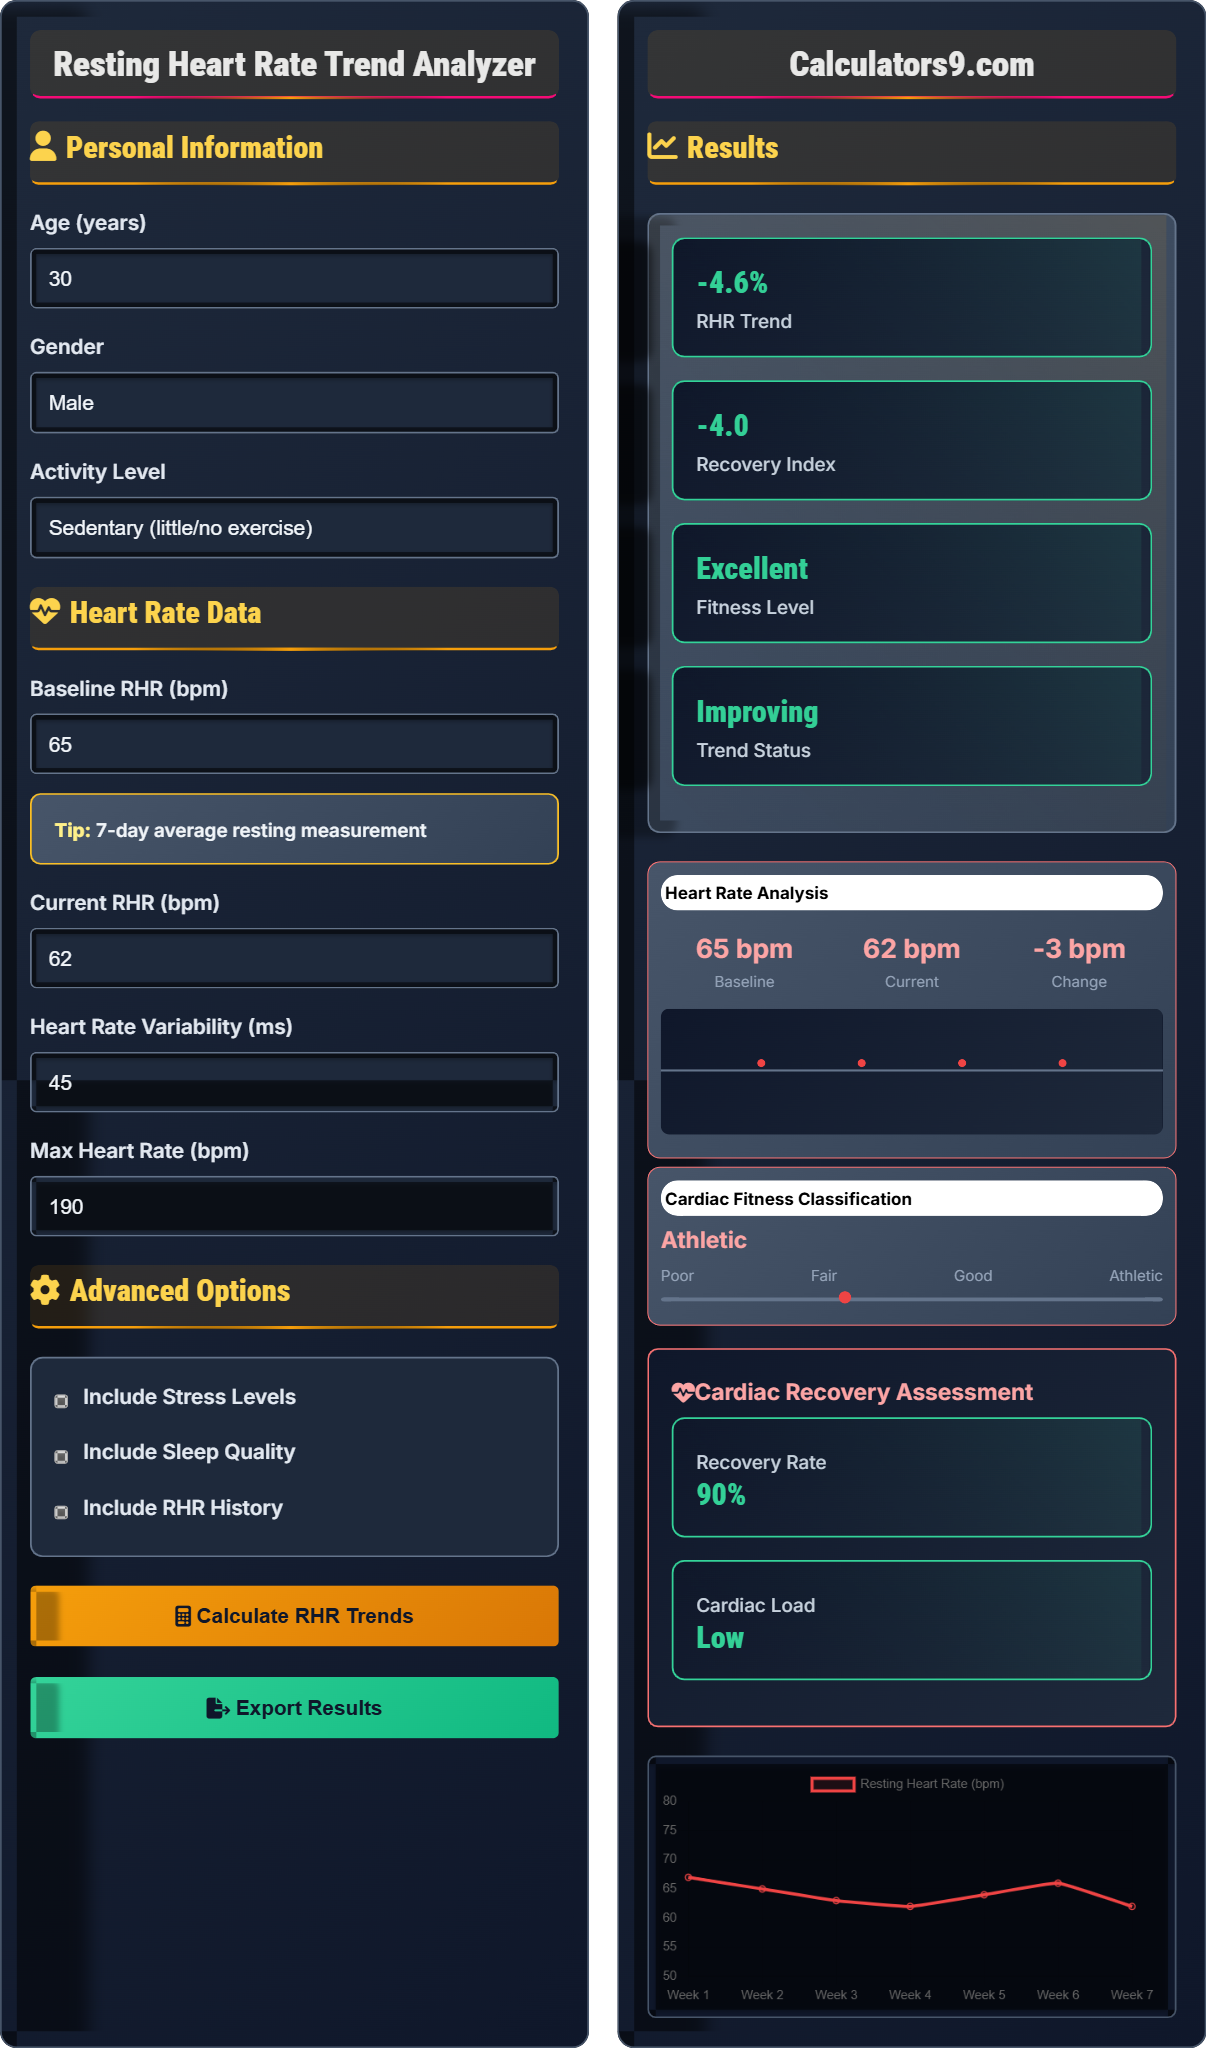
Example: Baseline RHR 65 bpm, Current RHR 62 bpm:
\( \text{Trend} = \frac{62 - 65}{65} \times 100 = -4.6\% \) (improvement)
\( \text{Recovery Index} = -4.6 \times 0.85 \times 1.2 = -4.7 \) (positive adaptation)
Personal Information
Heart Rate Data
Advanced Options
Results
| Day | RHR | Change | Recovery |
|---|
Understanding Resting Heart Rate
Resting heart rate (RHR) is the number of heartbeats per minute while at complete rest. It's a key indicator of cardiovascular fitness and overall health. A lower RHR generally indicates better cardiovascular fitness, as a stronger heart can pump more blood with each beat, requiring fewer beats to maintain circulation.
Resting heart rate classifications:
Classification ranges:
- Excellent: 40-50 bpm (elite athletes)
- Athletic: 50-60 bpm (trained athletes)
- Good: 60-70 bpm (fit individuals)
- Average: 70-80 bpm (general population)
- Poor: 80+ bpm (low fitness)
Resting heart rate trends can indicate various health conditions:
- Decreasing RHR: Improved fitness, better cardiac efficiency
- Increasing RHR: Possible overtraining, illness, stress, or dehydration
- Consistent RHR: Stable fitness and health status
- Sudden spikes: Illness, stress, or medication effects
- Aerobic Exercise: Regular cardio strengthens the heart muscle
- Stress Management: Meditation, yoga, and relaxation techniques
- Quality Sleep: 7-9 hours of restorative sleep nightly
- Hydration: Maintain proper fluid balance
- Consistent Monitoring: Track trends to identify patterns
RHR Metrics
Heart beats per minute at rest.
Count beats for 60 seconds after waking.
- Normal: 60-100 bpm
- Athletic: 40-60 bpm
- Track trends, not single values
Improvement Strategies
Optimize heart rate for better fitness.
- Regular aerobic exercise
- Stress management
- Quality sleep
- Proper hydration
- Individual variation exists
- Consistency is key
- Progress takes time
- Professional guidance recommended
Resting Heart Rate Learning Quiz
What does a decreasing resting heart rate typically indicate about cardiovascular fitness?
The answer is B) Improved fitness. A decreasing RHR indicates that the heart is becoming more efficient at pumping blood, which is a sign of improved cardiovascular fitness. A stronger heart can deliver the same amount of blood with fewer beats.
When the heart becomes stronger through regular exercise, it can pump more blood with each contraction. This means fewer beats are needed to maintain adequate circulation, resulting in a lower resting heart rate. This is why athletes often have RHRs in the 40-60 bpm range, compared to 60-100 bpm for the general population.
RHR: Resting Heart Rate - beats per minute at rest
Cardiac Efficiency: Heart's ability to pump blood effectively
Stroke Volume: Amount of blood pumped per heartbeat
• Lower RHR = better fitness
• Stronger heart = fewer beats needed
• Track trends over time
• Measure RHR at same time daily
• Take measurement after waking
• Track trends, not single values
• Confusing higher RHR with better fitness
• Not measuring consistently
• Ignoring measurement conditions
Calculate the RHR trend for someone whose baseline RHR was 68 bpm and current RHR is 64 bpm. Show your work.
Step 1: Apply the RHR trend formula: \( \text{Trend} = \frac{\text{Current RHR} - \text{Baseline RHR}}{\text{Baseline RHR}} \times 100 \)
Step 2: Substitute values: \( \text{Trend} = \frac{64 - 68}{68} \times 100 \)
Step 3: Calculate: \( \text{Trend} = \frac{-4}{68} \times 100 = -5.88\% \)
Step 4: Interpretation: -5.88% indicates a 5.88% improvement in RHR.
Therefore, the RHR trend is -5.9% (improvement).
This calculation demonstrates how to quantify changes in resting heart rate. The negative value indicates improvement (lower RHR), while positive values would indicate deterioration. A 5.9% improvement is significant and suggests positive cardiovascular adaptations from training or recovery.
RHR Trend: Percentage change in resting heart rate
Baseline RHR: Reference heart rate for comparison
Cardiac Adaptation: Heart's response to training
• Subtract baseline from current
• Divide by baseline value
• Multiply by 100 for percentage
• Use 7-day average as baseline
• Negative trend = improvement
• Positive trend = concern
• Dividing by current instead of baseline
• Forgetting to multiply by 100
• Not using consistent measurement conditions
An athlete's RHR has been steadily increasing from 48 bpm to 58 bpm over the past 3 weeks despite maintaining the same training load. What might this indicate and what should they do?
Step 1: Identify the change: 58 bpm - 48 bpm = 10 bpm increase
Step 2: Calculate percentage change: (10/48) × 100 = 20.8% increase
Step 3: Interpret the pattern: Steady increase in RHR despite consistent training
Step 4: Conclusion: This pattern strongly suggests overtraining syndrome, inadequate recovery, or possible illness.
Recommended actions: Reduce training intensity, prioritize sleep, consider medical evaluation, implement active recovery days.
This scenario demonstrates a classic sign of overtraining. When the body is under excessive stress without adequate recovery, the sympathetic nervous system becomes dominant, leading to elevated resting heart rate. This is often one of the earliest warning signs of overreaching or overtraining syndrome.
Overtraining: Excessive training without adequate recovery
Sympathetic Dominance: Stress response system activation
Recovery Monitoring: Tracking RHR for training load
• Rising RHR = possible overtraining
• Monitor trends, not single values
• Recovery is as important as training
• Track RHR daily
• Look for patterns over weeks
• Adjust training based on trends
• Ignoring RHR trends
• Pushing through elevated RHR
• Not considering recovery
A person starts an exercise program with an RHR of 72 bpm. After 8 weeks of consistent aerobic training, their RHR drops to 66 bpm. Calculate the improvement and explain the physiological adaptations responsible.
Step 1: Calculate absolute change: 72 bpm - 66 bpm = 6 bpm decrease
Step 2: Calculate percentage improvement: (6/72) × 100 = 8.33% improvement
Step 3: Physiological adaptations:
- Increased stroke volume: Heart pumps more blood per beat
- Improved cardiac efficiency: Heart works more effectively
- Enhanced oxygen delivery: Better circulation to tissues
- Stronger heart muscle: Improved contractility
The 8.33% improvement indicates significant positive cardiac adaptations.
This example shows how consistent aerobic exercise leads to measurable cardiac improvements. The 8.33% reduction in RHR represents substantial cardiovascular adaptations. The heart becomes more efficient, requiring fewer beats to maintain circulation, which reduces cardiac workload and improves overall fitness.
Stroke Volume: Blood volume pumped per heartbeat
Cardiac Efficiency: Heart's pumping effectiveness
Cardiac Adaptation: Heart's response to training
• Consistent training = cardiac adaptations
• Lower RHR = better efficiency
• Changes occur over weeks
• Track RHR to monitor progress
• Consistency is key for adaptations
• Patience needed for changes
• Expecting immediate changes
• Not tracking consistently
• Overtraining for quick results
Which factor has the most immediate impact on resting heart rate?
The answer is B) Previous night's sleep quality. Poor sleep elevates stress hormones like cortisol and adrenaline, which can raise RHR the following morning. Sleep quality has an immediate impact on autonomic nervous system balance.
Sleep quality directly affects the autonomic nervous system. Poor sleep activates the sympathetic nervous system (fight-or-flight response), increasing heart rate. Good sleep promotes parasympathetic dominance (rest-and-recovery mode), allowing for lower RHR. This effect is often noticeable within hours of a poor night's sleep.
Sympathetic Nervous System: Stress response system
Parasympathetic System: Recovery system
Autonomic Balance: Sympathetic vs parasympathetic
• Sleep affects RHR immediately
• Stress hormones elevate RHR
• Recovery is essential
• Prioritize quality sleep
• Track sleep alongside RHR
• Notice immediate effects
• Ignoring sleep quality
• Not connecting sleep to RHR
• Focusing only on exercise
FAQ
Q: How should I use RHR trends to adjust my training program?
A: Use RHR trends as a guide for training intensity:
Decreasing RHR (improvement): Indicates positive adaptation. Gradually increase training load, as the cardiovascular system is responding well to current stimulus.
Stable RHR: Suggests current training load is appropriate. Maintain current program while monitoring for continued adaptation.
Increasing RHR (+3-5 bpm): Potential sign of overreaching. Reduce training intensity, increase recovery, prioritize sleep and nutrition.
Significant Increase (+5+ bpm): Strong indicator of overtraining, illness, or stress. Implement rest days, reduce volume/intensity, consider medical evaluation.
Always look at trends over 3-7 days rather than single measurements. Combine RHR data with perceived exertion, motivation levels, and performance metrics for comprehensive training guidance.
Q: What's the best way to measure my resting heart rate accurately?
A: For accurate RHR measurement:
Timing: Measure immediately upon waking, while still lying in bed. This ensures you're in a true resting state before any activity affects your heart rate.
Method: Place two fingers on your wrist (radial artery) or neck (carotid artery). Count beats for a full 60 seconds, or count for 15 seconds and multiply by 4.
Conditions: Ensure you haven't exercised, eaten, drunk caffeine, or experienced stress in the past 2-3 hours. Empty bladder beforehand to avoid any stress response.
Consistency: Measure at the same time daily, in the same position, and record consistently for meaningful trends.
Technology: Modern smartwatches and chest straps can provide accurate overnight measurements, but manual counting remains the gold standard for verification.
Take measurements for 7 consecutive days to establish a reliable baseline average.