Cholesterol Ratio Calculator
Cardiovascular risk • Lipid profile • Treatment guidance
Cholesterol Ratios & Formulas:
Show CalculatorTC/HDL Ratio = Total Cholesterol ÷ HDL Cholesterol
LDL/HDL Ratio = LDL Cholesterol ÷ HDL Cholesterol
Non-HDL = Total Cholesterol - HDL Cholesterol
Optimal ratios for cardiovascular health:
- TC/HDL: < 4.0 for men, < 3.5 for women
- LDL/HDL: < 3.0 for optimal health
- HDL: >40 mg/dL for men, >50 mg/dL for women
- LDL: <100 mg/dL (optimal), <70 mg/dL (very high risk)
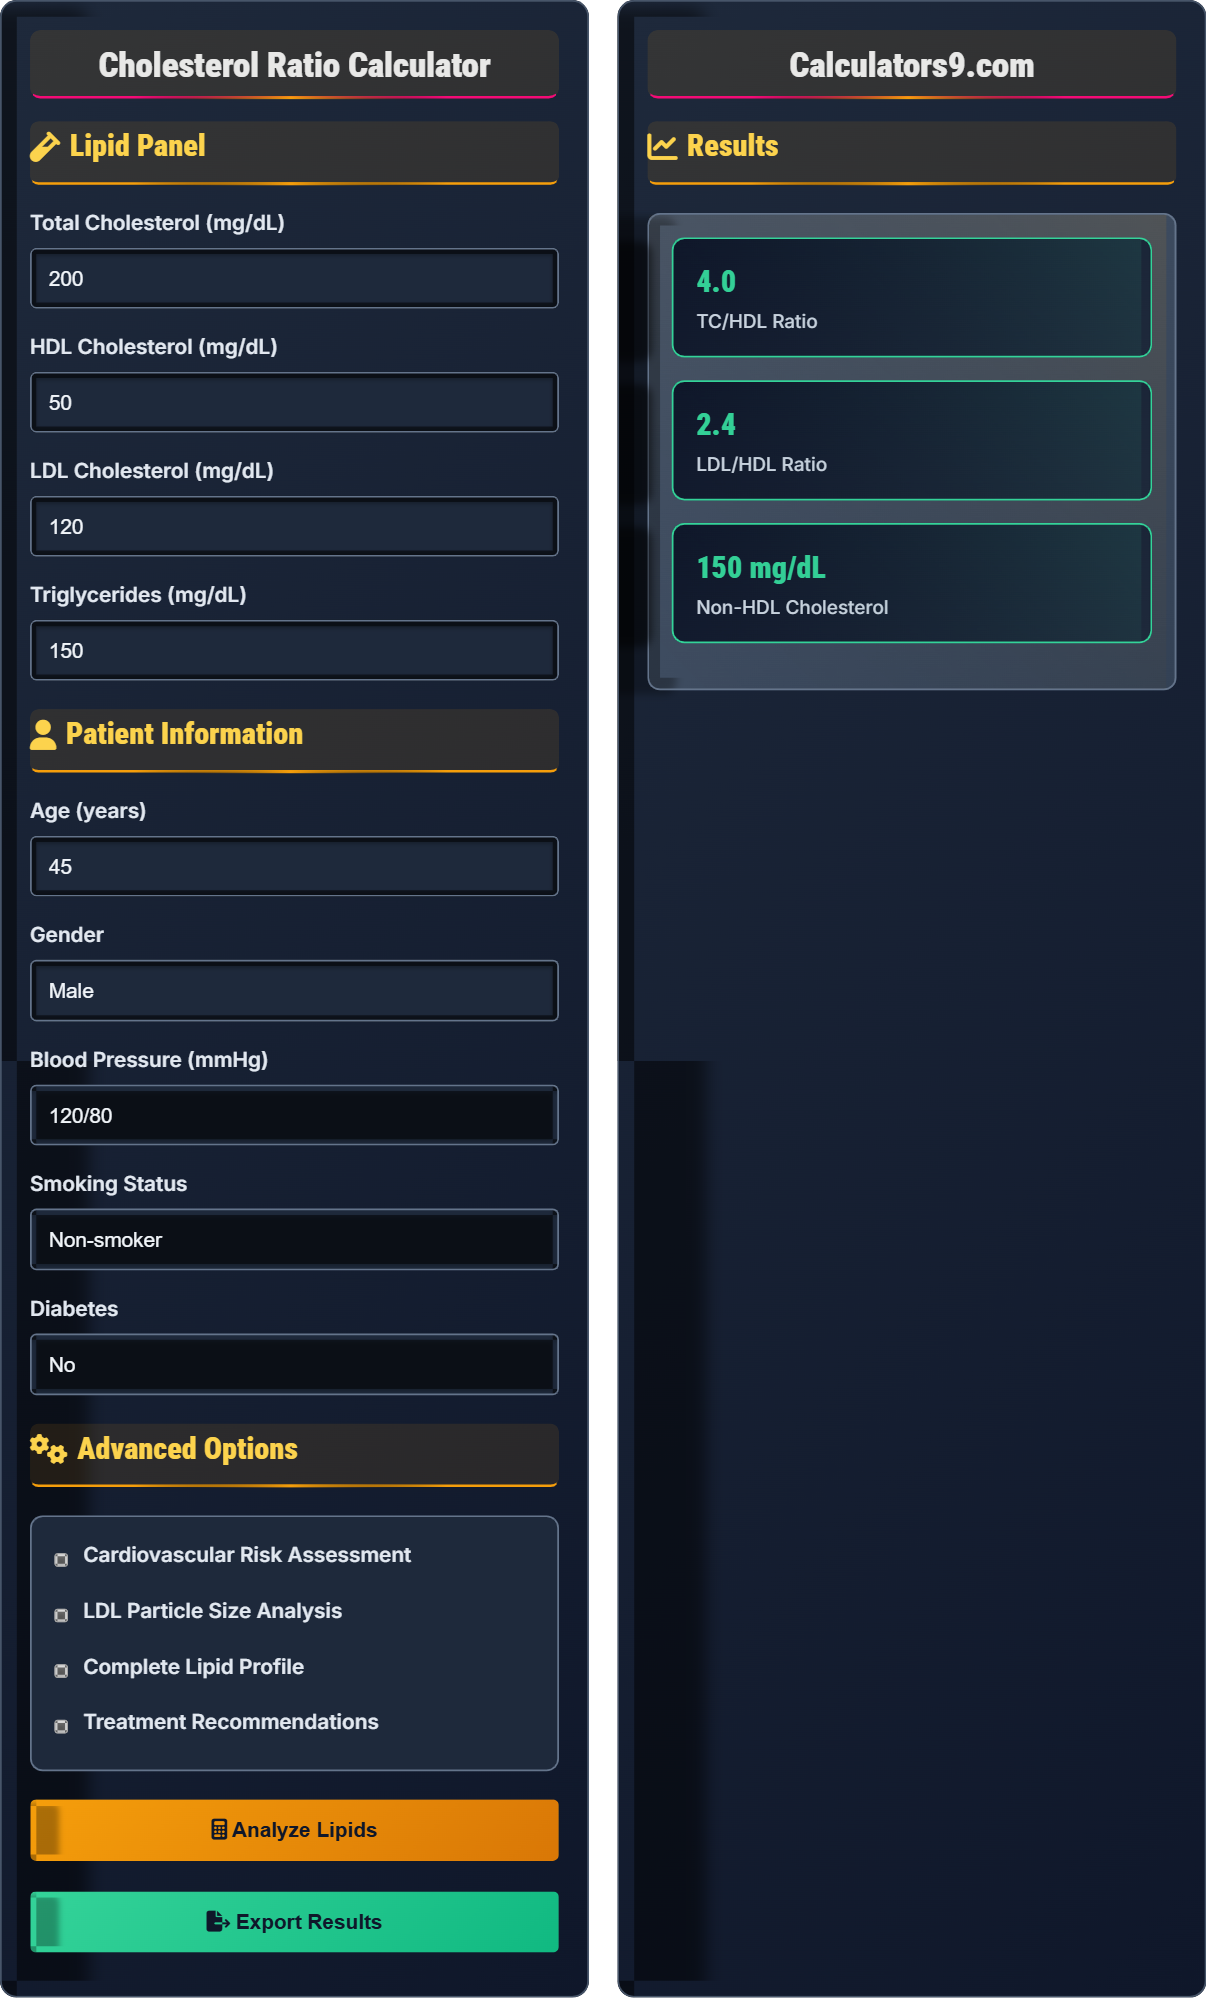
Example: With TC=200, HDL=50, LDL=120:
TC/HDL = 200 ÷ 50 = 4.0
LDL/HDL = 120 ÷ 50 = 2.4
This indicates moderate cardiovascular risk with optimal LDL/HDL ratio.
Lipid Panel
Patient Information
Advanced Options
Results
Cholesterol Fundamentals
Cholesterol ratios compare different types of cholesterol to assess cardiovascular risk. The TC/HDL ratio and LDL/HDL ratio are stronger predictors of heart disease risk than individual cholesterol numbers alone.
- TC/HDL Ratio: Total Cholesterol ÷ HDL
- LDL/HDL Ratio: LDL ÷ HDL
- Non-HDL: Total - HDL (all "bad" cholesterol)
- Triglyceride/HDL: TG ÷ HDL
- TC/HDL: < 4.0 (men), < 3.5 (women)
- LDL/HDL: < 3.0
- HDL: >40 mg/dL (men), >50 mg/dL (women)
- LDL: <100 mg/dL (optimal)
Health Implications
Elevated cholesterol ratios indicate increased risk of atherosclerosis (plaque buildup in arteries), leading to heart disease, stroke, and peripheral vascular disease.
- High TC/HDL ratio (>5.0)
- Low HDL (<40 mg/dL)
- High LDL (>130 mg/dL)
- High triglycerides (>150 mg/dL)
- Small, dense LDL particles
- Heart-healthy diet
- Regular exercise
- Medication if indicated
- Regular monitoring
- Address other risk factors
Cholesterol Ratio Learning Quiz
What does a TC/HDL ratio of 5.0 indicate for a 50-year-old male patient?
The answer is C) Above average cardiovascular risk. For males, the optimal TC/HDL ratio is less than 4.0. A ratio of 5.0 is significantly above this threshold, indicating increased cardiovascular risk. This ratio suggests that the patient has 5 times more total cholesterol than protective HDL cholesterol.
The TC/HDL ratio is a powerful predictor of cardiovascular risk because it considers both harmful and protective lipids simultaneously. A high ratio indicates an imbalance between total cholesterol (including all harmful fractions) and HDL (the protective fraction). This is more informative than looking at individual cholesterol numbers alone.
TC/HDL Ratio: Total cholesterol divided by HDL cholesterol
HDL Cholesterol: "Good" cholesterol that removes plaque from arteries
Atherogenic: Promoting formation of fatty deposits in arteries
• Optimal TC/HDL: <4.0 for men, <3.5 for women
• Higher ratios = higher cardiovascular risk
• Ratio is better predictor than individual values
• Remember: "Lower ratio = better health"
• Target ratio is like a safety score: lower is safer
• Aim for ratio close to 3.0 for optimal health
• Focusing only on LDL without considering HDL
• Not calculating the ratio as a combined indicator
• Misunderstanding the significance of the ratio
Calculate the LDL/HDL ratio for a patient with LDL of 140 mg/dL and HDL of 35 mg/dL. Interpret the result and explain its clinical significance in cardiovascular risk assessment.
LDL/HDL Ratio = LDL ÷ HDL
LDL/HDL Ratio = 140 ÷ 35 = 4.0
Interpretation: This ratio of 4.0 is significantly elevated above the optimal level of less than 3.0.
Clinical Significance:
- Indicates high atherogenic risk (plaque-forming potential)
- Reflects imbalance between harmful LDL and protective HDL
- Associated with 3-4 times higher cardiovascular event risk
- May indicate insulin resistance or metabolic syndrome
- Strongly predictive of coronary artery disease
This patient requires aggressive lipid management including lifestyle changes and likely medication therapy to reduce cardiovascular risk.
The LDL/HDL ratio specifically measures the balance between harmful and protective lipoproteins. LDL is directly atherogenic (promotes plaque formation), while HDL is anti-atherogenic (removes cholesterol from plaques). A ratio of 4.0 means for every unit of protective HDL, there are 4 units of harmful LDL, creating a highly pro-inflammatory state in the arteries.
LDL/HDL Ratio: Direct comparison of harmful to protective cholesterol
Atherogenic Index: Measure of tendency to form arterial plaque
Lipoprotein Balance: Relationship between different cholesterol types
• Optimal LDL/HDL: <3.0
• Ratio >4.0 indicates high risk
• More predictive than individual LDL levels
• Calculate: LDL ÷ HDL = ratio
• Aim for ratio <3.0 for best outcomes
• Higher HDL improves the ratio significantly
• Not dividing LDL by HDL to get the ratio
• Misinterpreting the clinical significance of high ratios
• Overlooking the protective role of HDL
A patient has a total cholesterol of 220 mg/dL and HDL of 45 mg/dL. Calculate their non-HDL cholesterol and explain why this measurement is important for cardiovascular risk assessment, especially in patients with high triglycerides.
Step 1: Calculate Non-HDL Cholesterol
Non-HDL = Total Cholesterol - HDL
Non-HDL = 220 - 45 = 175 mg/dL
Step 2: Assess the result
Optimal Non-HDL is <130 mg/dL, so 175 mg/dL is elevated.
Importance of Non-HDL Cholesterol:
- Measures all atherogenic (plaque-forming) cholesterol
- Includes LDL plus VLDL, IDL, and other harmful particles
- More accurate risk predictor when triglycerides >200 mg/dL
- Used as secondary target when LDL is difficult to measure
- Reflects remnant cholesterol particles
For patients with high triglycerides, non-HDL becomes the primary target because LDL calculations become unreliable due to Friedewald equation limitations.
Non-HDL cholesterol is increasingly recognized as a superior marker for cardiovascular risk because it captures all the harmful cholesterol particles, not just LDL. When triglycerides are elevated, the traditional Friedewald equation for calculating LDL becomes inaccurate, making non-HDL a more reliable measure. It represents the total burden of atherogenic particles in circulation.
Non-HDL Cholesterol: All cholesterol except HDL (LDL + VLDL + remnants)
Remnant Particles: Triglyceride-rich lipoproteins that promote atherosclerosis
Friedewald Equation: Method to calculate LDL from other lipids (inaccurate at high TG)
• Non-HDL = Total - HDL
• Target <130 mg/dL (optimal)
• Use when TG >200 mg/dL
• Non-HDL = everything bad minus the good
• Add 30 mg/dL to LDL target for Non-HDL target
• More important than LDL when triglycerides are high
• Not calculating non-HDL when triglycerides are elevated
• Relying solely on LDL in high-triglyceride situations
• Not understanding the limitations of Friedewald equation
A 55-year-old diabetic male smoker with hypertension has the following lipid panel: TC=210, HDL=38, LDL=125, TG=220. Calculate his TC/HDL ratio and assess his overall cardiovascular risk. What treatment approach would you recommend based on current guidelines?
Step 1: Calculate TC/HDL ratio
TC/HDL = 210 ÷ 38 = 5.5
Step 2: Calculate Non-HDL
Non-HDL = 210 - 38 = 172 mg/dL
Step 3: Assess risk factors
- Age 55 (risk factor)
- Male gender (risk factor)
- Diabetes (major risk multiplier)
- Smoking (risk factor)
- Hypertension (risk factor)
- Low HDL (38 mg/dL)
- Elevated TC/HDL ratio (5.5)
- Elevated triglycerides (220 mg/dL)
Step 4: Risk stratification
This patient has multiple risk factors and would be classified as very high risk for cardiovascular events. The TC/HDL ratio of 5.5 is significantly elevated, and the presence of diabetes places him in the highest risk category.
Step 5: Treatment recommendation
Intensive statin therapy targeting LDL <70 mg/dL or 50% reduction. Lifestyle modifications including Mediterranean diet, regular exercise, smoking cessation, and diabetes management.
This case demonstrates how multiple risk factors compound cardiovascular risk. The patient's diabetes makes him equivalent to someone who has already had a heart attack in terms of risk. The low HDL and high TC/HDL ratio further amplify the risk. This patient needs aggressive intervention because his 10-year risk is likely >20%.
Very High Risk: Patients with established CVD, diabetes with target organ damage, or 10-year risk >7.5%
LDL Target: <70 mg/dL for very high risk patients
Risk Multiplier: Condition that significantly increases CVD risk
• Diabetes = coronary artery disease equivalent
• Very high risk: LDL <70 mg/dL target
• Multiple risk factors exponentially increase risk
• Count risk factors: age, sex, smoking, diabetes, HTN, family history
• Use ASCVD risk calculator for 10-year risk
• Aggressive treatment for diabetes patients
• Not recognizing diabetes as a major risk multiplier
• Using standard risk calculators for diabetic patients
• Underestimating the impact of multiple risk factors
Why is LDL particle size important in cardiovascular risk assessment?
The answer is B) Smaller, denser particles penetrate arterial walls more easily. Small, dense LDL particles (Pattern B) are more atherogenic because they are more susceptible to oxidation, can penetrate the arterial wall more easily, and remain in circulation longer. Large, buoyant LDL particles (Pattern A) are less harmful and associated with lower cardiovascular risk.
LDL particle analysis reveals that not all LDL is equal. Small, dense LDL particles have several properties that make them more dangerous: they're more prone to oxidation, can cross the endothelial barrier more easily, and are cleared from circulation more slowly. This explains why some patients with similar LDL cholesterol levels have different cardiovascular risks.
LDL Particle Size: Diameter of LDL cholesterol particles
Pattern A: Large, buoyant LDL particles (low risk)
Pattern B: Small, dense LDL particles (high risk)
• Small, dense LDL = higher risk
• Large, buoyant LDL = lower risk
• Particle size explains discordance in risk
• Think "small and sneaky" = more dangerous
• Size matters more than total number in some cases
• Consider when standard risk factors don't explain events
• Assuming all LDL particles are the same
• Not considering particle size in risk assessment
• Misunderstanding the atherogenic potential of different sizes
FAQ
Q: What's the difference between good and bad cholesterol?
A: Cholesterol isn't inherently "good" or "bad" - it's how it's transported that matters:
- HDL ("Good"): High-density lipoprotein carries cholesterol away from arteries back to liver for disposal.
- LDL ("Bad"): Low-density lipoprotein delivers cholesterol to tissues but can deposit in artery walls.
- VLDL: Very-low-density lipoprotein primarily carries triglycerides.
The TC/HDL ratio combines both protective (HDL) and harmful (everything else) elements for a comprehensive risk assessment.
Q: How do I interpret a TC/HDL ratio of 3.5 for a 40-year-old female?
A: For a 40-year-old female, a TC/HDL ratio of 3.5 is considered excellent. The optimal threshold for women is less than 3.5, so this patient is at the upper limit of optimal range.
For context:
- Excellent: <3.0
- Good: 3.0-3.5
- Average: 3.6-4.5
- Above average: 4.6-7.0
- High risk: >7.0
This patient has an excellent cholesterol profile with a favorable balance between total cholesterol and protective HDL cholesterol.