Clinic Revenue Calculator
Fast financial tool • 2026 standards
Clinic Revenue Formula:
Show the calculator\( \text{Monthly Revenue} = \text{Patients per Day} \times \text{Days per Month} \times \text{Average Revenue per Patient} \)
Where:
- Patients per Day = average patients seen daily
- Days per Month = operating days per month
- Average Revenue per Patient = avg revenue per visit
This formula calculates the total monthly revenue generated by a clinic based on patient volume and average charges. It helps healthcare administrators forecast income and plan operations.
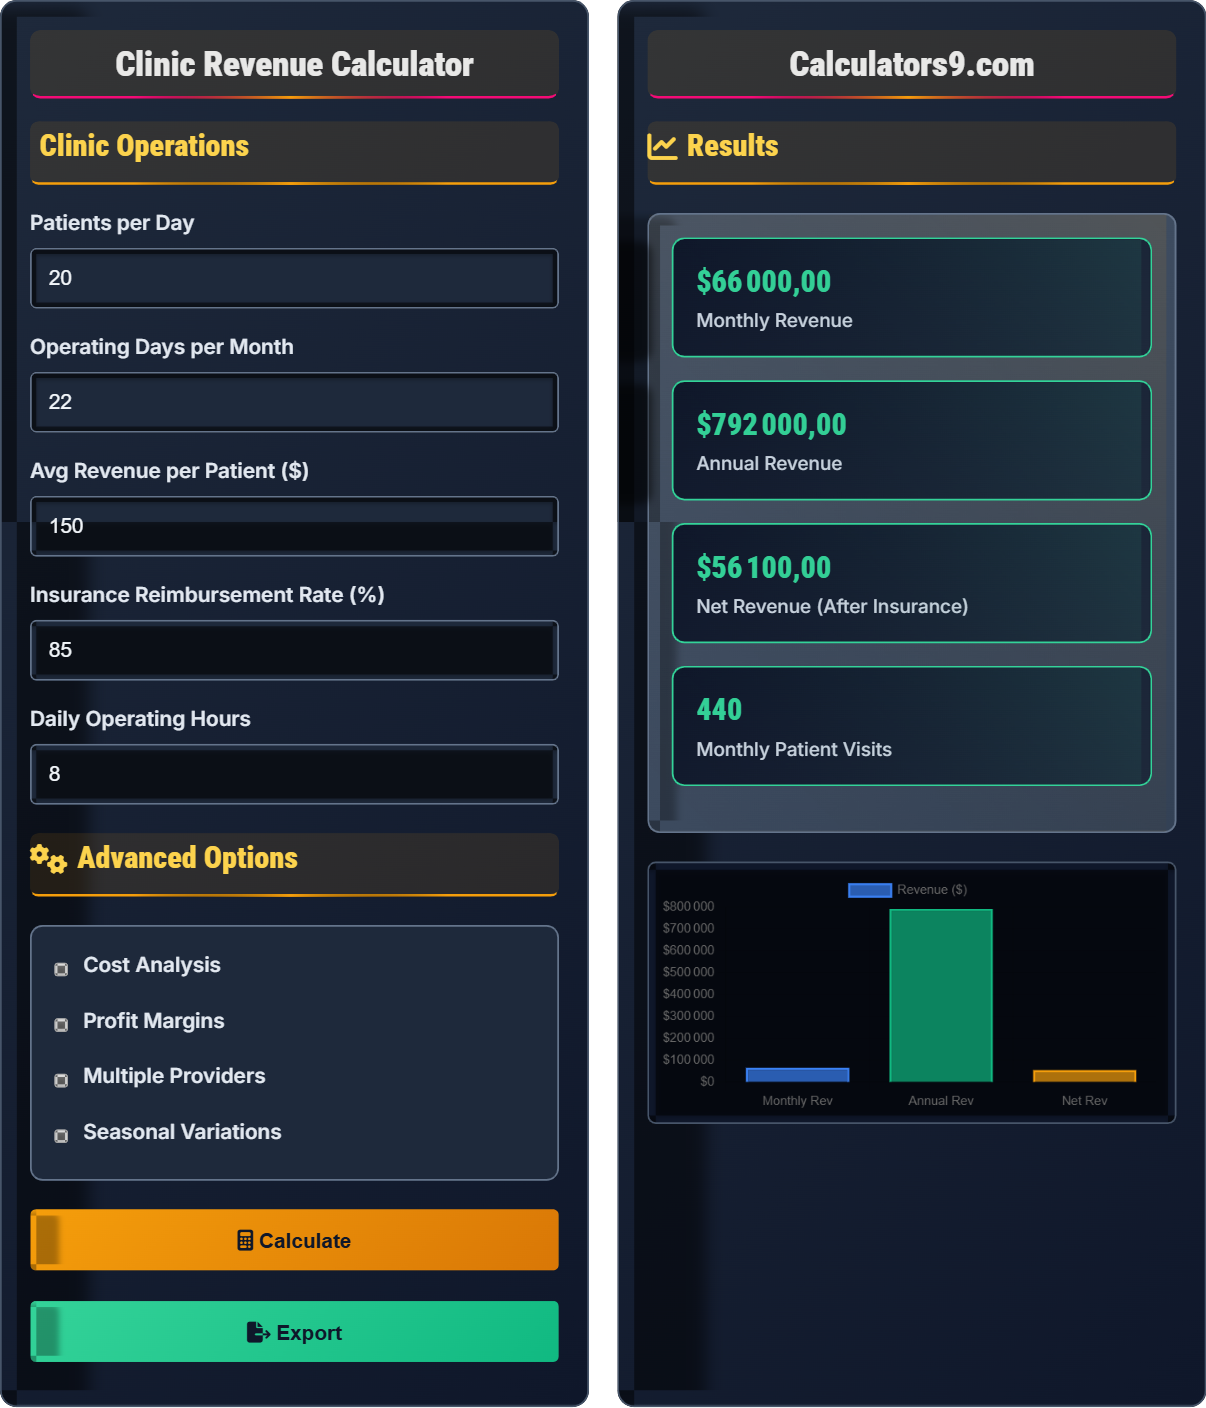
Example: For a clinic seeing 20 patients per day, operating 22 days per month, with an average revenue of $150 per patient:
\( \text{Monthly Revenue} = 20 \times 22 \times 150 = \$66,000 \)
Thus, the clinic generates $66,000 monthly.
Clinic Operations
Advanced Options
Results
| Metric | Amount |
|---|---|
| Monthly Revenue | $66,000.00 |
| Insurance Deductions | $9,900.00 |
| Net Revenue | $56,100.00 |
| Annual Revenue | $792,000.00 |
| Metric | Value |
|---|---|
| Patients per Day | 20 |
| Operating Days/Month | 22 |
| Avg Revenue/Patient | $150.00 |
| Daily Operating Hours | 8 hours |
Comprehensive Healthcare Administration Guide
Healthcare revenue management encompasses all processes related to generating income from patient care services. It includes patient registration, charge capture, coding, billing, collections, and revenue cycle management. Effective revenue management ensures clinics can cover operational costs while maintaining quality patient care.
The standard clinic revenue calculation uses the following formula:
Where:
- \(R\) = Monthly Revenue
- \(P\) = Patients per day
- \(D\) = Operating days per month
- \(A\) = Average revenue per patient
Typical clinic expenses include:
- Personnel: 60-70% of total expenses (salaries, benefits, malpractice)
- Facility: 10-15% (rent, utilities, maintenance)
- Equipment: 5-10% (medical devices, furniture, IT systems)
- Administrative: 8-12% (billing, supplies, insurance)
- Other: 3-7% (marketing, professional fees, etc.)
- Improve scheduling: Reduce no-shows and optimize appointment slots
- Enhance collections: Implement point-of-service payment collection
- Reduce denials: Improve documentation and coding accuracy
- Expand services: Offer additional procedures or specialties
- Technology adoption: Use RCM software for efficiency
Healthcare Finance Basics
Process of managing patient care episodes from registration to payment collection.
\(R = P \times D \times A\)
Where R=revenue, P=patients, D=days, A=average revenue.
- Track insurance reimbursement rates
- Monitor denial rates regularly
- Optimize staff-to-patient ratios
Strategies
Maximize income while maintaining patient satisfaction and quality care.
- Automate billing processes
- Reduce claim denials
- Optimize staffing levels
- Implement efficient scheduling
- Insurance reimbursement trends
- Regulatory compliance
- Patient satisfaction scores
- Quality metrics
Healthcare Finance Learning Quiz
A clinic sees 25 patients per day, operates 20 days per month, and has an average revenue of $120 per patient. What is the monthly revenue?
The answer is C) $60,000. Using the revenue formula: Monthly Revenue = Patients per Day × Operating Days × Average Revenue per Patient. Calculation: 25 × 20 × $120 = $60,000.
Understanding basic revenue calculations is fundamental to healthcare administration. The formula multiplies three key operational metrics: patient volume, operational frequency, and revenue per encounter. This simple multiplication provides a baseline for financial planning and performance evaluation.
Revenue Cycle: Process of managing patient care episodes from registration to payment
AR Aging: Accounts receivable aging report showing outstanding balances
Net Collection Rate: Percentage of charges collected after adjustments
• Multiply all three factors to get total revenue
• Consider insurance reimbursement rates in net revenue
• Track seasonal variations in patient volume
• Remember: Revenue = Volume × Frequency × Rate
• Monitor daily patient counts for early trend identification
• Compare monthly revenue to budget targets
• Forgetting to account for insurance adjustments
• Not considering seasonal variations in volume
• Miscounting operating days per month
A clinic generates $80,000 in monthly revenue with staff costs of $35,000, facility costs of $8,000, and other expenses of $7,000. What is the monthly profit and profit margin? Show your calculation steps.
Step 1: Calculate total expenses: $35,000 + $8,000 + $7,000 = $50,000
Step 2: Calculate profit: $80,000 - $50,000 = $30,000
Step 3: Calculate profit margin: ($30,000 ÷ $80,000) × 100 = 37.5%
The clinic has a monthly profit of $30,000 and a profit margin of 37.5%.
Profit margin is a critical metric in healthcare administration that measures profitability relative to revenue. It indicates how efficiently a clinic converts revenue into profit. A higher profit margin suggests better cost management and operational efficiency. Understanding this calculation helps administrators identify areas for improvement.
Gross Revenue: Total revenue before any deductions
Net Revenue: Revenue after insurance adjustments
Profit Margin: Percentage of revenue that becomes profit
• Profit = Revenue - Total Expenses
• Profit Margin = (Profit ÷ Revenue) × 100
• Healthcare margins typically range from 15-25%
• Target 20-25% profit margin for sustainability
• Monitor expense categories separately
• Compare margins to industry benchmarks
• Confusing gross vs. net revenue in calculations
• Forgetting to include all expense categories
• Not accounting for insurance adjustments
FAQ
Q: How does insurance reimbursement affect clinic revenue calculations?
A: Insurance reimbursement significantly impacts actual clinic revenue through several mechanisms:
- Contractual Adjustments: Insurers negotiate discounted rates below standard charges
- Denials: Claims rejected due to coding errors, missing documentation, or policy exclusions
- Downcoding: Insurers reducing procedure codes to lower-paying alternatives
- Timely Filing: Claims denied for submission after deadlines
For example, if a clinic bills $100 for a service but the insurance contract allows only $80, the contractual adjustment of $20 reduces revenue. With an 85% reimbursement rate, a clinic billing $100,000 would receive only $85,000, representing a $15,000 reduction due to insurance adjustments.
Effective revenue management requires tracking both gross charges and net collections to understand true financial performance.
Q: What are the key performance indicators (KPIs) for clinic revenue management?
A: Critical KPIs for clinic revenue management include:
- Days in AR: Average age of outstanding receivables (target: 30-40 days)
- Collection Rate: Percentage of charges collected (target: 95%+)
- Denial Rate: Percentage of claims denied initially (target: 5% or less)
- Cost per Visit: Administrative costs divided by patient visits
- Revenue per Provider: Revenue generated per physician/provider
These metrics help administrators identify inefficiencies in the revenue cycle. For instance, high days in AR suggest slow collections, while elevated denial rates indicate coding or documentation issues. Regular monitoring of these KPIs enables proactive management of financial performance.
Industry benchmarks vary by specialty and region, but generally, clinics should aim for collection rates above 95%, days in AR under 40, and denial rates below 5%.