Patient Wait Time Calculator
Healthcare operations tool • 2026 edition
Patient Wait Time Formula:
Show the calculator\( WT = (BP + SP + TP) \times (1 + CR) \times (1 + CF) \times (1 - EF) \)
Where:
- \( WT \) = Patient Wait Time (minutes)
- \( BP \) = Base Processing Time (registration, check-in)
- \( SP \) = Service Provider Time (appointment duration)
- \( TP \) = Treatment Preparation Time
- \( CR \) = Capacity Ratio (demand vs. capacity)
- \( CF \) = Complexity Factor (case complexity multiplier)
- \( EF \) = Efficiency Factor (process optimization)
This formula calculates patient wait times based on facility capacity, appointment scheduling, and operational efficiency. Healthcare facilities should aim to keep wait times under 20 minutes for optimal patient satisfaction.
Example: For a facility with \( BP = 5 \) minutes, \( SP = 15 \) minutes, \( TP = 10 \) minutes, capacity ratio of 1.2 (overbooked), complexity factor of 0.3 (moderate), and efficiency factor of 0.1 (10% optimization):
\( WT = (5 + 15 + 10) \times (1 + 1.2) \times (1 + 0.3) \times (1 - 0.1) = 30 \times 2.2 \times 1.3 \times 0.9 = 77.22 \) minutes
Thus, the estimated wait time would be 77 minutes.
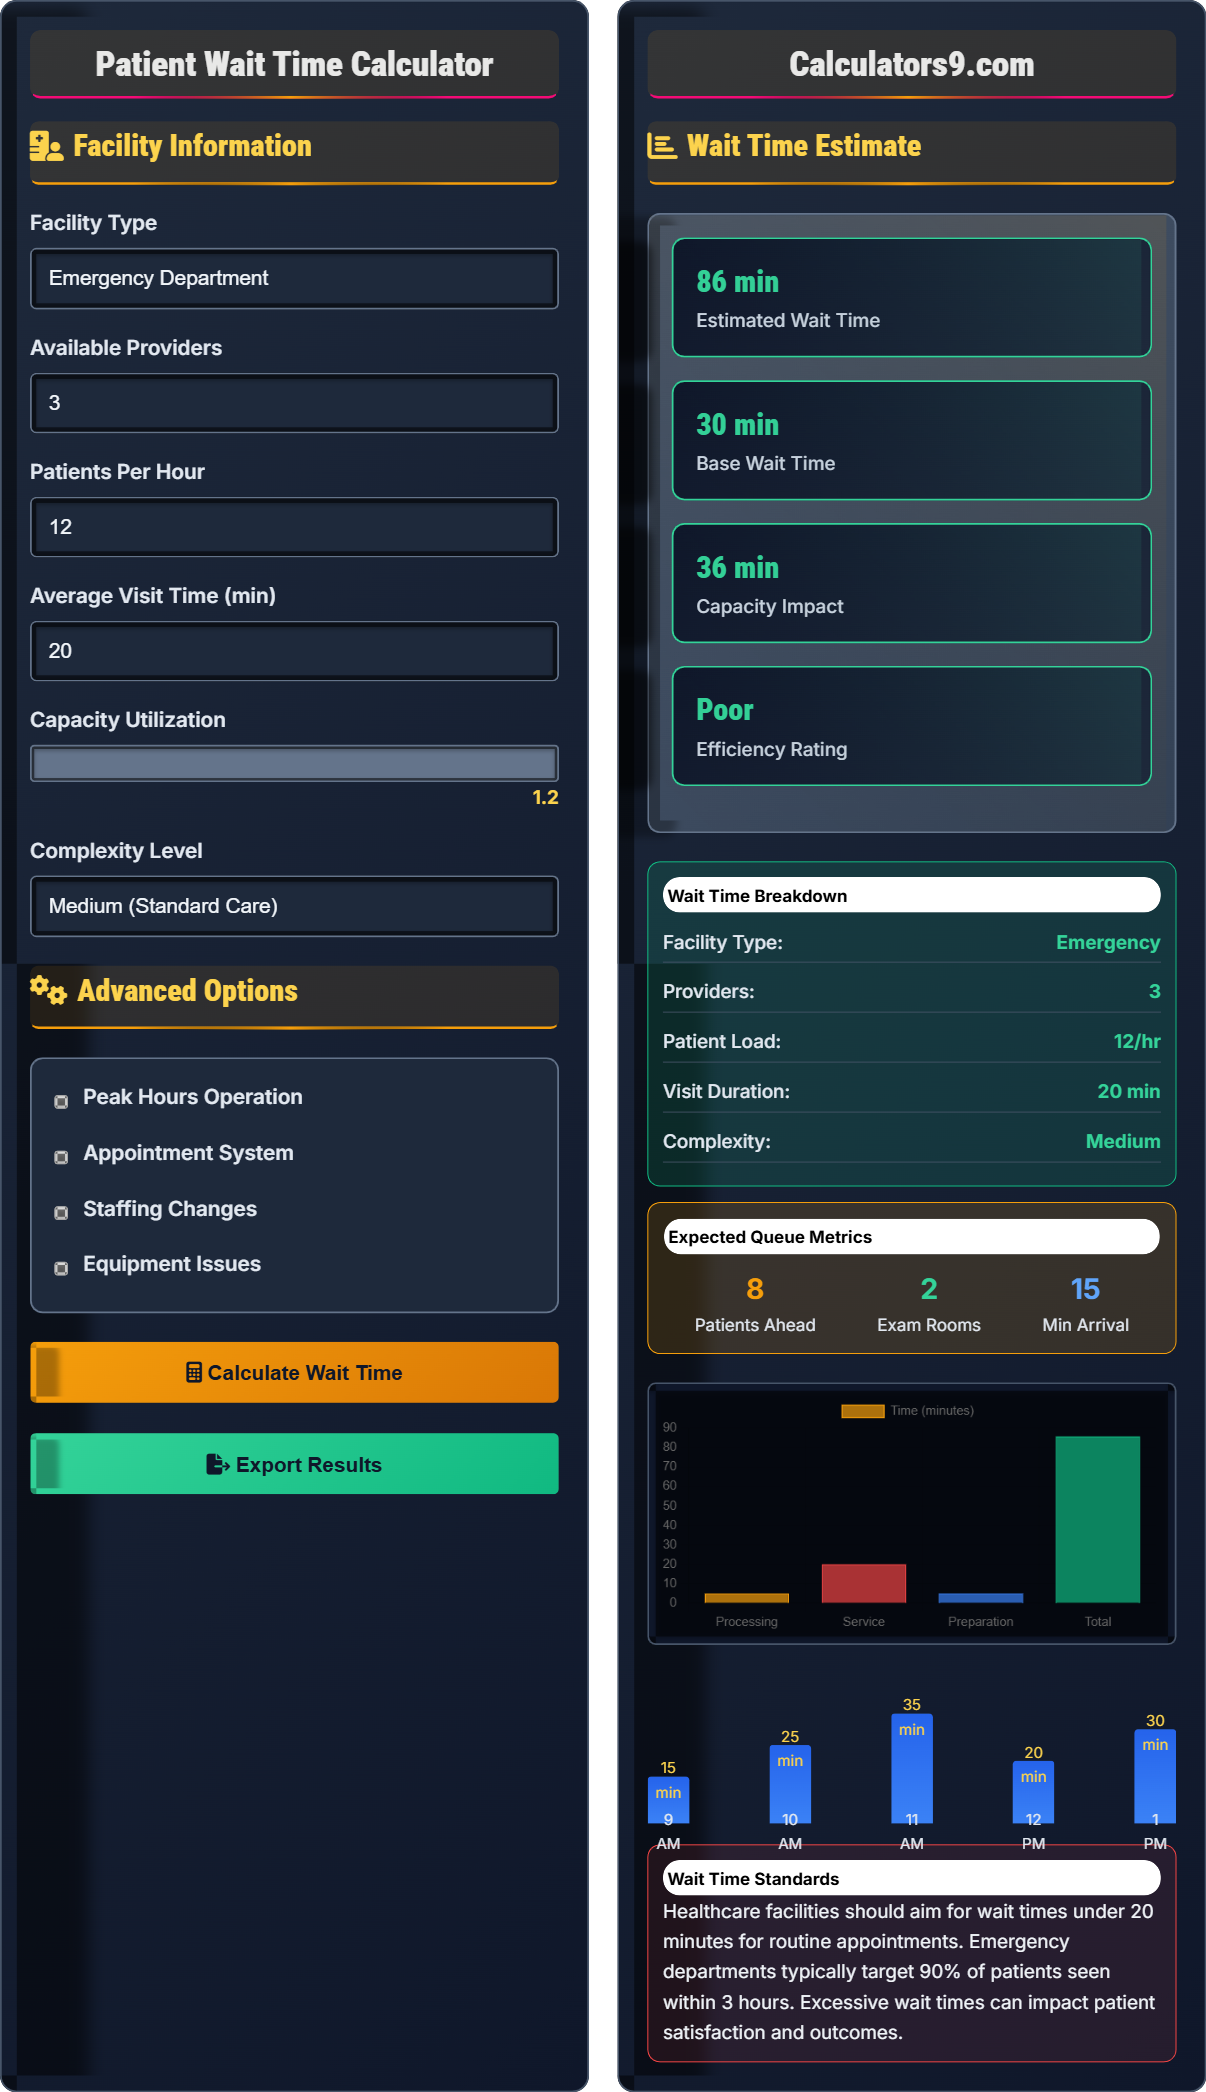
Facility Information
Advanced Options
Wait Time Estimate
Healthcare facilities should aim for wait times under 20 minutes for routine appointments. Emergency departments typically target 90% of patients seen within 3 hours. Excessive wait times can impact patient satisfaction and outcomes.
Patient Wait Time Framework
Healthcare wait times significantly impact patient satisfaction and outcomes. Industry benchmarks suggest patients should wait no more than 20 minutes for routine appointments. Emergency departments have specific targets, with 90% of patients expected to be seen within 3 hours. Efficient patient flow management is critical for healthcare operations.
The standard patient wait time calculation uses the following formula:
Where:
- \(WT\) = Patient Wait Time
- \(BP\) = Base Processing Time
- \(SP\) = Service Provider Time
- \(TP\) = Treatment Preparation Time
- \(CR\) = Capacity Ratio
- \(CF\) = Complexity Factor
- \(EF\) = Efficiency Factor
Healthcare facilities use various benchmarks to measure performance:
- Routine Appointments: Target: < 20 minutes wait time
- Emergency Department: Target: 90% seen within 3 hours
- New Patient Visits: Target: < 30 minutes wait time
- Follow-up Visits: Target: < 15 minutes wait time
- Peak Hours: May accept 25-40% longer waits
- Patient Satisfaction: Decreases significantly after 30-minute waits
- Dynamic Scheduling: Adjust appointment lengths based on complexity
- Queue Management: Real-time tracking of patient flow
- Resource Allocation: Match staff to patient demand patterns
- Technology Integration: Electronic check-in and notifications
- Process Optimization: Eliminate redundant steps in workflow
- Peak Management: Stagger appointments during busy periods
Wait Time Framework
Registration, provider time, and preparation time contribute to total wait time.
\(WT = (BP + SP + TP) \times (1 + CR) \times (1 + CF) \times (1 - EF)\)
Where WT=wait time, BP=base processing, SP=service provider time, TP=treatment prep, CR=capacity ratio, CF=complexity factor, EF=efficiency factor.
- Routine appointments: < 20 minutes
- Emergency: 90% within 3 hours
- Patient satisfaction: decreases after 30 mins
Operational Analysis
Capacity, complexity, and efficiency factors influence patient wait times.
- Assess current capacity vs. demand
- Identify bottlenecks in workflow
- Implement process improvements
- Monitor wait time metrics
- Peak hours require special attention
- Complex cases need more time
- Technology can improve efficiency
Patient Wait Time Learning Quiz
What is the industry benchmark for routine appointment wait times in healthcare facilities?
The answer is C) Under 20 minutes. The industry benchmark for routine appointment wait times in healthcare facilities is under 20 minutes. This benchmark is widely accepted as a standard for patient satisfaction and operational efficiency.
Healthcare facilities use evidence-based benchmarks to measure performance. The 20-minute benchmark for routine appointments is derived from patient satisfaction studies showing significant dissatisfaction after this threshold. This metric helps facilities optimize their operations and staffing.
Industry Benchmark: Standard measurement for comparing performance
Patient Satisfaction: Measure of patient contentment with care
Operational Efficiency: How effectively resources are used
• Routine appointments: < 20 minutes
• Patient satisfaction decreases after 30 minutes
• Peak hours may allow longer waits
• Monitor wait times regularly
• Compare to industry benchmarks
• Adjust staffing based on patterns
• Confusing benchmarks for different settings
• Not considering complexity variations
• Ignoring peak hour impacts
Calculate the wait time for a clinic with base processing time of 5 minutes, service provider time of 15 minutes, treatment preparation time of 10 minutes, capacity utilization ratio of 1.2 (20% over capacity), complexity factor of 0.3 (30% additional time), and efficiency improvement of 0.1 (10% improvement). Show your work.
Using the wait time formula: \(WT = (BP + SP + TP) \times (1 + CR) \times (1 + CF) \times (1 - EF)\)
Given:
- BP = 5 minutes
- SP = 15 minutes
- TP = 10 minutes
- CR = 1.2 (capacity ratio)
- CF = 0.3 (complexity factor)
- EF = 0.1 (efficiency factor)
Step 1: Calculate base time = BP + SP + TP = 5 + 15 + 10 = 30 minutes
Step 2: Apply capacity factor = 30 × (1 + 1.2) = 30 × 2.2 = 66 minutes
Step 3: Apply complexity factor = 66 × (1 + 0.3) = 66 × 1.3 = 85.8 minutes
Step 4: Apply efficiency factor = 85.8 × (1 - 0.1) = 85.8 × 0.9 = 77.22 minutes
This calculation demonstrates how multiple factors compound to affect wait times. The capacity ratio of 1.2 means the facility is operating 20% over capacity, significantly increasing wait times. The complexity factor adds another 30%, while efficiency improvements reduce the total by 10%.
Base Processing Time (BP): Registration and check-in time
Service Provider Time (SP): Time with healthcare provider
Capacity Ratio (CR): Demand vs. capacity multiplier
• Add time components first
• Apply factors sequentially
• Efficiency factor reduces total time
• Calculate base time first
• Verify each factor application
• Remember efficiency improves (reduces) time
• Confusing addition vs. multiplication of factors
• Applying efficiency factor incorrectly
• Misunderstanding capacity ratio
A clinic has 3 providers who can see 4 patients per hour each, but the clinic is receiving 15 patients per hour. Calculate the capacity utilization ratio and the resulting impact on wait times if base processing time is 25 minutes. Assume other factors remain constant (complexity factor 0.2, efficiency factor 0.05).
Step 1: Calculate capacity
Provider capacity = 3 providers × 4 patients/hour = 12 patients/hour
Step 2: Calculate utilization ratio
Capacity utilization = Demand/Capacity = 15/12 = 1.25
Step 3: Calculate base wait time
Base time = 25 minutes
Step 4: Apply factors
Wait time = 25 × (1 + 1.25) × (1 + 0.2) × (1 - 0.05)
= 25 × 2.25 × 1.2 × 0.95 = 64.125 minutes
The clinic is operating at 125% capacity, resulting in approximately 64 minutes wait time.
This example shows how exceeding capacity dramatically increases wait times. With a capacity utilization of 1.25 (25% over capacity), the wait time becomes 2.56 times the base time. This demonstrates the importance of matching capacity to demand in healthcare operations.
Capacity Utilization: Ratio of demand to available capacity
Provider Capacity: Patients a provider can see per unit time
Overbooking: Having more demand than capacity
• Utilization ratio = demand/capacity
• Ratio > 1.0 indicates overcapacity
• Small excess capacity has large impact
• Monitor capacity ratios regularly
• Plan for capacity during peak hours
• Consider flexible staffing models
• Confusing demand with capacity
• Not accounting for capacity ratios
• Underestimating impact of overcapacity
A hospital emergency department currently has an average wait time of 90 minutes with 15 providers seeing 3 patients per hour each. They implement efficiency improvements that reduce wait times by 25% and add 2 more providers. Calculate the new average wait time assuming patient volume remains constant at 45 patients per hour.
Step 1: Calculate current capacity
Current capacity = 15 providers × 3 patients/hour = 45 patients/hour
Step 2: Calculate utilization
Current utilization = 45 demand / 45 capacity = 1.0
Step 3: Calculate new capacity
New capacity = 17 providers × 3 patients/hour = 51 patients/hour
Step 4: Calculate new utilization
New utilization = 45 demand / 51 capacity = 0.88
Step 5: Apply efficiency improvement
Old wait time with new capacity = 90 × (0.88/1.0) = 79.2 minutes
New wait time = 79.2 × (1 - 0.25) = 79.2 × 0.75 = 59.4 minutes
The new average wait time would be approximately 59 minutes.
This demonstrates how combining capacity increases with efficiency improvements creates multiplicative benefits. Adding providers alone would reduce utilization from 1.0 to 0.88, but the 25% efficiency improvement provides additional reduction. Both strategies together achieve greater improvement than either alone.
Efficiency Improvement: Process enhancements that reduce time
Capacity Increase: Adding resources to handle more patients
Multiplicative Benefits: Combined improvements yield greater results
• Capacity and efficiency improvements compound
• Utilization = demand/capacity
• Lower utilization reduces wait times
• Combine capacity and efficiency improvements
• Monitor utilization ratios
• Measure efficiency improvements quantitatively
• Not accounting for combined effects
• Assuming linear relationships
• Overlooking utilization impact
How do peak hours typically affect patient wait times in healthcare facilities?
The answer is C) Peak hours typically increase wait times by 25-40%. During peak hours, patient volume exceeds normal capacity, leading to longer queues and wait times. Healthcare facilities often experience 25-40% longer waits during peak periods unless they adjust staffing accordingly.
Peak hours create temporary capacity constraints that significantly impact wait times. The 25-40% increase is a common industry observation based on patient flow patterns. Facilities can manage this through staggered appointments, additional staffing, or patient education about optimal visit times.
Peak Hours: Times with highest patient volume
Capacity Constraints: Limited resources during high demand
Queue Formation: Patients waiting for service
• Peak hours increase demand vs. capacity
• Wait times increase exponentially when over capacity
• Staffing adjustments can mitigate impact
• Identify peak hour patterns
• Adjust staffing during peaks
• Stagger appointments to smooth demand
• Assuming peak hours improve efficiency
• Not planning for capacity during peaks
• Underestimating demand fluctuations
Healthcare Operations FAQ
Q: How does patient complexity affect wait times in healthcare facilities?
A: Patient complexity significantly impacts wait times through the complexity factor \( CF \) in our formula: \( WT = (BP + SP + TP) \times (1 + CR) \times (1 + CF) \times (1 - EF) \).
For example, if routine patients have \( CF = 0.1 \) and complex patients have \( CF = 0.5 \), the wait time calculation changes significantly:
For routine care: \( WT = 30 \times (1 + 1.0) \times (1 + 0.1) \times (1 - 0.05) = 30 \times 2.0 \times 1.1 \times 0.95 = 62.7 \) minutes
For complex care: \( WT = 30 \times (1 + 1.0) \times (1 + 0.5) \times (1 - 0.05) = 30 \times 2.0 \times 1.5 \times 0.95 = 85.5 \) minutes
Thus, complex patients increase wait times by approximately 37%. Healthcare facilities should schedule complex cases strategically to minimize impact on overall patient flow.
Q: What's the relationship between provider availability and patient wait times?
A: Provider availability directly affects the capacity ratio \( CR \) in our wait time formula. The relationship is inversely proportional - as provider capacity increases, wait times decrease exponentially.
For a facility with 3 providers seeing 4 patients per hour each (12 total/hour capacity) but receiving 15 patients per hour:
\( CR = 15/12 = 1.25 \)
If they add one more provider (16 total/hour capacity):
\( CR = 15/16 = 0.94 \)
Assuming base wait time of 25 minutes: Original wait = \( 25 \times (1 + 1.25) = 56.25 \) minutes; New wait = \( 25 \times (1 + 0.94) = 48.5 \) minutes.
This represents a 14% reduction in wait time from adding just one provider, demonstrating the significant impact of capacity on patient experience.