Readmission Risk Calculator
Healthcare operations tool • 2026 edition
Readmission Risk Formula:
Show the calculator\( RR = BR \times (1 + AF) \times (1 + CF) \times (1 + DF) \times (1 - EF) \times (1 + HF) \)
Where:
- \( RR \) = Readmission Risk (%)
- \( BR \) = Baseline Risk (population average)
- \( AF \) = Age Factor (demographic risk)
- \( CF \) = Condition Factor (diagnosis-specific risk)
- \( DF \) = Discharge Factor (care transition quality)
- \( EF \) = Efficiency Factor (process improvements)
- \( HF \) = Health Status Factor (comorbidity impact)
This formula calculates 30-day readmission risk based on patient characteristics and healthcare delivery factors. Healthcare facilities aim to maintain readmission rates below 15% to ensure quality care and avoid penalties.
Example: For a patient with baseline risk of 12%, age factor of 0.3 (30% increase for elderly), condition factor of 0.5 (50% increase for heart failure), discharge factor of 0.2 (20% increase for poor transition), efficiency factor of 0.1 (10% improvement), and health factor of 0.4 (40% increase for comorbidities):
\( RR = 12 \times (1 + 0.3) \times (1 + 0.5) \times (1 + 0.2) \times (1 - 0.1) \times (1 + 0.4) = 12 \times 1.3 \times 1.5 \times 1.2 \times 0.9 \times 1.4 = 39.3\% \)
Thus, the calculated readmission risk would be 39.3%.
Patient Information
Advanced Options
Risk Analysis
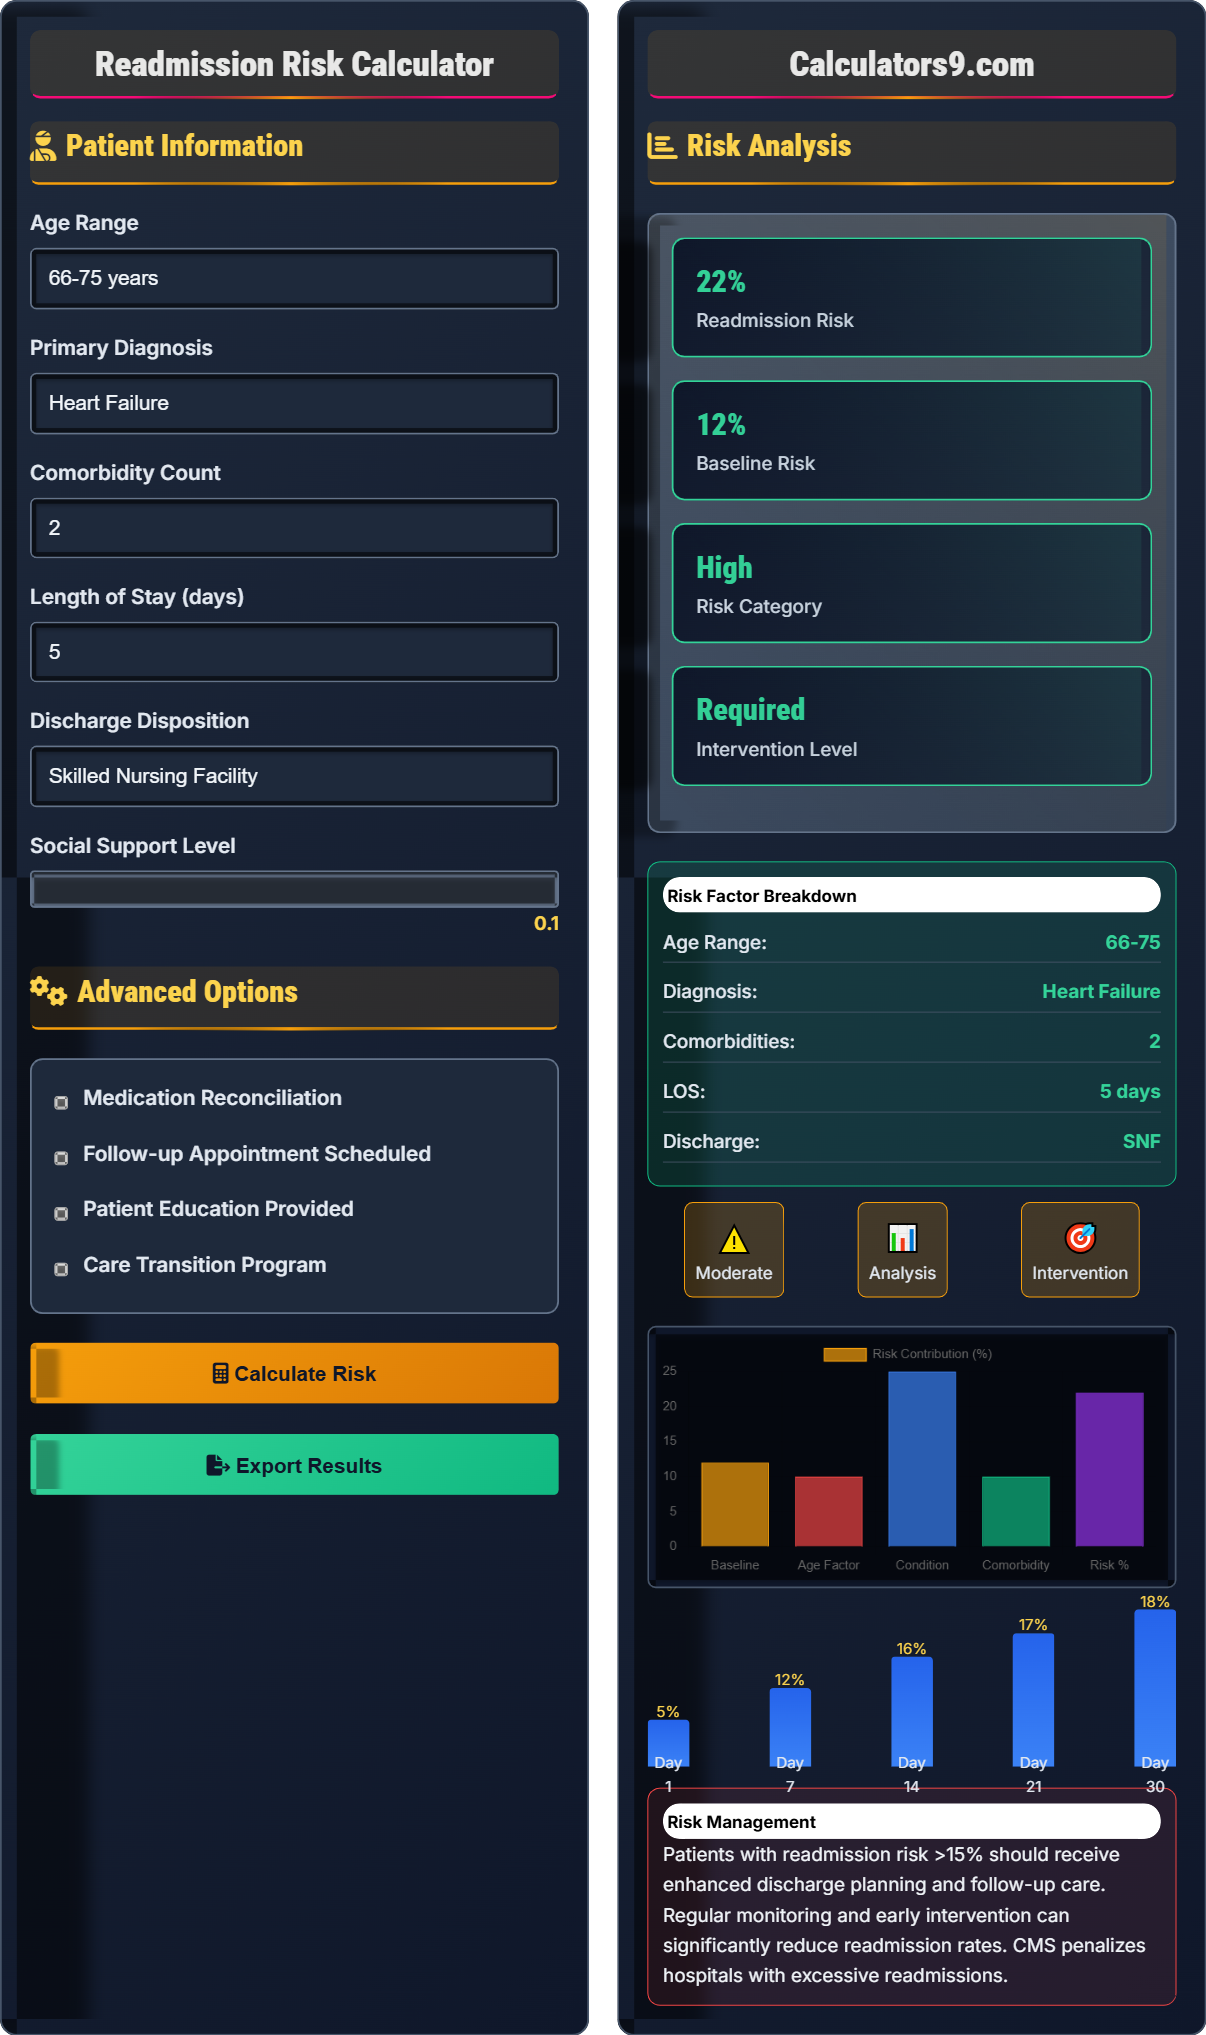
Patients with readmission risk >15% should receive enhanced discharge planning and follow-up care. Regular monitoring and early intervention can significantly reduce readmission rates. CMS penalizes hospitals with excessive readmissions.
Readmission Risk Framework
Healthcare readmission risk assessment is critical for quality care and financial performance. The industry standard for 30-day readmission rates is below 15%. CMS tracks readmissions for specific conditions and penalizes hospitals with excessive rates through the Hospital Readmissions Reduction Program.
The standard healthcare readmission risk calculation uses the following formula:
Where:
- \(RR\) = Readmission Risk
- \(BR\) = Baseline Risk
- \(AF\) = Age Factor
- \(CF\) = Condition Factor
- \(DF\) = Discharge Factor
- \(EF\) = Efficiency Factor
- \(HF\) = Health Status Factor
Healthcare facilities track various metrics related to readmission risk:
- Heart Failure: 25% average readmission rate
- Pneumonia: 18% average readmission rate
- Myocardial Infarction: 17% average readmission rate
- COPD: 23% average readmission rate
- Stroke: 15% average readmission rate
- Diabetes: 16% average readmission rate
- Comprehensive Discharge Planning: Medication reconciliation and follow-up scheduling
- Patient Education: Self-care instructions and warning signs
- Care Coordination: Communication between providers
- Transitional Care Programs: Bridge between hospital and home
- Remote Monitoring: Post-discharge health tracking
- Medication Management: Ensuring compliance and safety
Risk Framework
Age, diagnosis, and comorbidities determine readmission risk levels.
\(RR = BR \times (1 + AF) \times (1 + CF) \times (1 + DF) \times (1 - EF) \times (1 + HF)\)
Where RR=risk, BR=baseline risk, AF=age factor, CF=condition factor, DF=discharge factor, EF=efficiency factor, HF=health factor.
- Target: < 15% readmission rate
- High-risk: > 20% readmission rate
- Heart failure: 25% average
Risk Analysis
Age, diagnosis, and discharge disposition influence readmission risk.
- Identify baseline risk
- Assess patient factors
- Apply condition factors
- Calculate final risk
- Multiple comorbidities increase risk
- Advanced age increases risk
- Proper discharge planning reduces risk
Readmission Risk Learning Quiz
What is the industry standard for 30-day hospital readmission rates?
The answer is B) Below 15%. The industry standard for 30-day hospital readmission rates is below 15%. CMS monitors readmissions for specific conditions and penalizes hospitals with rates exceeding this threshold.
Healthcare facilities must maintain readmission rates below 15% to avoid financial penalties from CMS. This standard ensures quality care and proper discharge planning. Rates above 15% indicate potential issues with care transitions or patient education.
Readmission Rate: Percentage of patients returning within 30 days
CMS: Centers for Medicare & Medicaid Services
Hospital Readmissions Reduction Program: CMS penalty program
• Target: < 15% readmission rate
• CMS tracks specific conditions
• Excessive rates result in penalties
• Monitor readmission rates regularly
• Focus on high-risk conditions
• Implement transition programs
• Accepting high readmission rates
• Not tracking condition-specific rates
• Inadequate discharge planning
Calculate the readmission risk for a patient with baseline risk of 12%, age factor of 0.3 (30% increase for elderly), condition factor of 0.5 (50% increase for heart failure), discharge factor of 0.2 (20% increase for poor transition), efficiency factor of 0.1 (10% improvement), and health factor of 0.4 (40% increase for comorbidities). Show your work.
Using the risk formula: \(RR = BR \times (1 + AF) \times (1 + CF) \times (1 + DF) \times (1 - EF) \times (1 + HF)\)
Given:
- BR = 12% (baseline risk)
- AF = 0.3 (age factor)
- CF = 0.5 (condition factor)
- DF = 0.2 (discharge factor)
- EF = 0.1 (efficiency factor)
- HF = 0.4 (health factor)
Step 1: Apply all factors
RR = 12 × (1 + 0.3) × (1 + 0.5) × (1 + 0.2) × (1 - 0.1) × (1 + 0.4)
= 12 × 1.3 × 1.5 × 1.2 × 0.9 × 1.4
= 12 × 2.9484 = 35.38%
The calculated readmission risk is 35.4%.
This calculation demonstrates how multiple factors compound to affect readmission risk. The age factor increases risk by 30%, the condition factor by 50%, and the health factor by 40%. The efficiency factor reduces risk by 10%. The combined effect results in a significantly elevated risk of 35.4%.
Baseline Risk (BR): Population average risk
Age Factor (AF): Demographic risk multiplier
Condition Factor (CF): Diagnosis-specific risk
• Add 1 to positive factors
• Subtract efficiency from 1
• Multiply all factors together
• Calculate intermediate products
• Verify factor applications
• Round to one decimal place
• Forgetting to add 1 to factors
• Misapplying efficiency factor
• Not following order of operations
A hospital has 200 patients discharged with heart failure (average 25% readmission rate), 150 with pneumonia (18% average), and 100 with COPD (23% average). If they implement a care transition program that reduces readmissions by 20%, calculate the expected number of readmissions avoided compared to baseline. What is the financial impact if each readmission costs $15,000?
Step 1: Calculate baseline readmissions
Heart failure: 200 × 0.25 = 50 readmissions
Pneumonia: 150 × 0.18 = 27 readmissions
COPD: 100 × 0.23 = 23 readmissions
Baseline total: 50 + 27 + 23 = 100 readmissions
Step 2: Calculate readmissions with 20% reduction
Heart failure: 200 × (0.25 × 0.8) = 40 readmissions
Pneumonia: 150 × (0.18 × 0.8) = 21.6 ≈ 22 readmissions
COPD: 100 × (0.23 × 0.8) = 18.4 ≈ 18 readmissions
Reduced total: 40 + 22 + 18 = 80 readmissions
Step 3: Calculate avoided readmissions and savings
Avoided readmissions: 100 - 80 = 20 readmissions
Financial savings: 20 × $15,000 = $300,000
The program would avoid 20 readmissions and save $300,000.
This example shows how condition-specific readmission rates can be aggregated to calculate overall impact. The care transition program reduces readmissions by 20% across all conditions, resulting in significant cost savings. This demonstrates the value of targeted interventions for high-risk populations.
Readmission Avoidance: Prevention of unplanned returns
Financial Impact: Cost savings from prevented readmissionsPopulation-Level Impact: Aggregate effect across patient groups
• Calculate per-condition rates separately
• Apply reduction factors uniformly
• Aggregate for total impact
• Track condition-specific rates
• Calculate financial impact
• Monitor program effectiveness
• Not considering condition-specific rates
• Forgetting to round appropriately
• Not calculating financial impact
A hospital spends $200,000 on medication reconciliation programs. The program reduces medication-related readmissions by 35%. If medication errors cause 12% of all readmissions and the hospital has 5,000 discharges annually with a 15% readmission rate, calculate the financial return. Assume each readmission costs $15,000 and medication errors account for 30% of readmissions.
Step 1: Calculate total readmissions
Total readmissions = 5,000 × 0.15 = 750 readmissions
Step 2: Calculate medication-related readmissions
Medication-related readmissions = 750 × 0.30 = 225 readmissions
Step 3: Calculate readmissions prevented by program
Prevented readmissions = 225 × 0.35 = 78.75 ≈ 79 readmissions
Step 4: Calculate financial savings
Financial savings = 79 × $15,000 = $1,185,000
Step 5: Calculate ROI
ROI = ($1,185,000 - $200,000) / $200,000 = 4.93 or 493%
The program saves $1.185 million with an ROI of 493%.
This demonstrates the significant financial return from medication reconciliation programs. By preventing 79 medication-related readmissions, the hospital achieves a 493% return on investment. This shows how targeted quality initiatives can generate substantial value while improving patient safety.
Medication Reconciliation: Verification of medication orders
Return on Investment (ROI): Financial benefit relative to cost
Quality Initiative: Program to improve patient outcomes
• Calculate baseline readmissions first
• Identify medication-related portion
• Apply prevention rate
• Include both clinical and financial benefits
• Consider ongoing operational costs
• Track program effectiveness metrics
• Not considering medication-related portion
• Forgetting to calculate ROI
• Not including all cost factors
Which of the following interventions typically has the greatest impact on reducing readmission rates?
The answer is C) Medication reconciliation and discharge planning. Research shows that comprehensive discharge planning with medication reconciliation has the greatest impact on reducing readmissions, typically reducing rates by 15-30%. This addresses the most common causes of readmissions: medication errors and poor care transitions.
Medication reconciliation and comprehensive discharge planning address multiple risk factors simultaneously. It ensures patients understand their medications, have follow-up care scheduled, and understand warning signs. This multi-faceted approach is more effective than single-intervention approaches.
Medication Reconciliation: Verifying medication accuracy
Discharge Planning: Coordinated care transition
Risk Reduction: Interventions to prevent readmissions
• Multi-faceted approaches are most effective
• Address root causes of readmissions
• Focus on medication safety
• Implement comprehensive transition programs
• Focus on medication safety
• Ensure follow-up care
• Relying on single interventions
• Not addressing medication safety
• Inadequate discharge planning
Healthcare Operations FAQ
Q: How do comorbidities affect readmission risk?
A: Comorbidities significantly increase readmission risk through the health status factor \( HF \) in our formula: \( RR = BR \times (1 + AF) \times (1 + CF) \times (1 + DF) \times (1 - EF) \times (1 + HF) \).
Each additional comorbidity typically increases risk by 5-10%. For example:
• 0 comorbidities: Base risk
• 1-2 comorbidities: 15-25% increase in risk
• 3-4 comorbidities: 30-45% increase in risk
• 5+ comorbidities: 50-70% increase in risk
For a patient with baseline risk of 12% and 3 comorbidities (HF = 0.4):
\( RR = 12 \times (1 + 0.4) = 12 \times 1.4 = 16.8\% \)
Comorbidities complicate recovery, increase medication complexity, and require more intensive monitoring.
Q: What's the relationship between length of stay and readmission risk?
A: Length of stay has a complex relationship with readmission risk. Very short stays (1-2 days) may indicate insufficient treatment, while very long stays (7+ days) may indicate complications. The discharge factor \( DF \) in our formula accounts for this:
• 1-2 days: +15% risk (insufficient treatment)
• 3-5 days: Baseline risk
• 6-7 days: +5% risk (potential complications)
• 8+ days: +15% risk (significant complications)
For a patient with 8-day LOS and baseline risk of 15%:
\( RR = 15 \times (1 + 0.15) = 17.25\% \)
Optimal length of stay balances adequate treatment with early discharge to prevent hospital-acquired complications.