CAGR Calculator
Compound annual growth rate • 2026 investment tool
CAGR Formula:
Show CalculatorThe Compound Annual Growth Rate (CAGR) is calculated as: CAGR = (End Value ÷ Beginning Value)^(1 ÷ Number of Years) - 1
CAGR measures the mean annual growth rate of an investment over a specified time period, smoothing out volatility. It's essential for comparing investment performance across different time frames and asset classes.
For portfolio analysis, CAGR helps investors understand the geometric progression ratio that provides a steady rate of return over time.
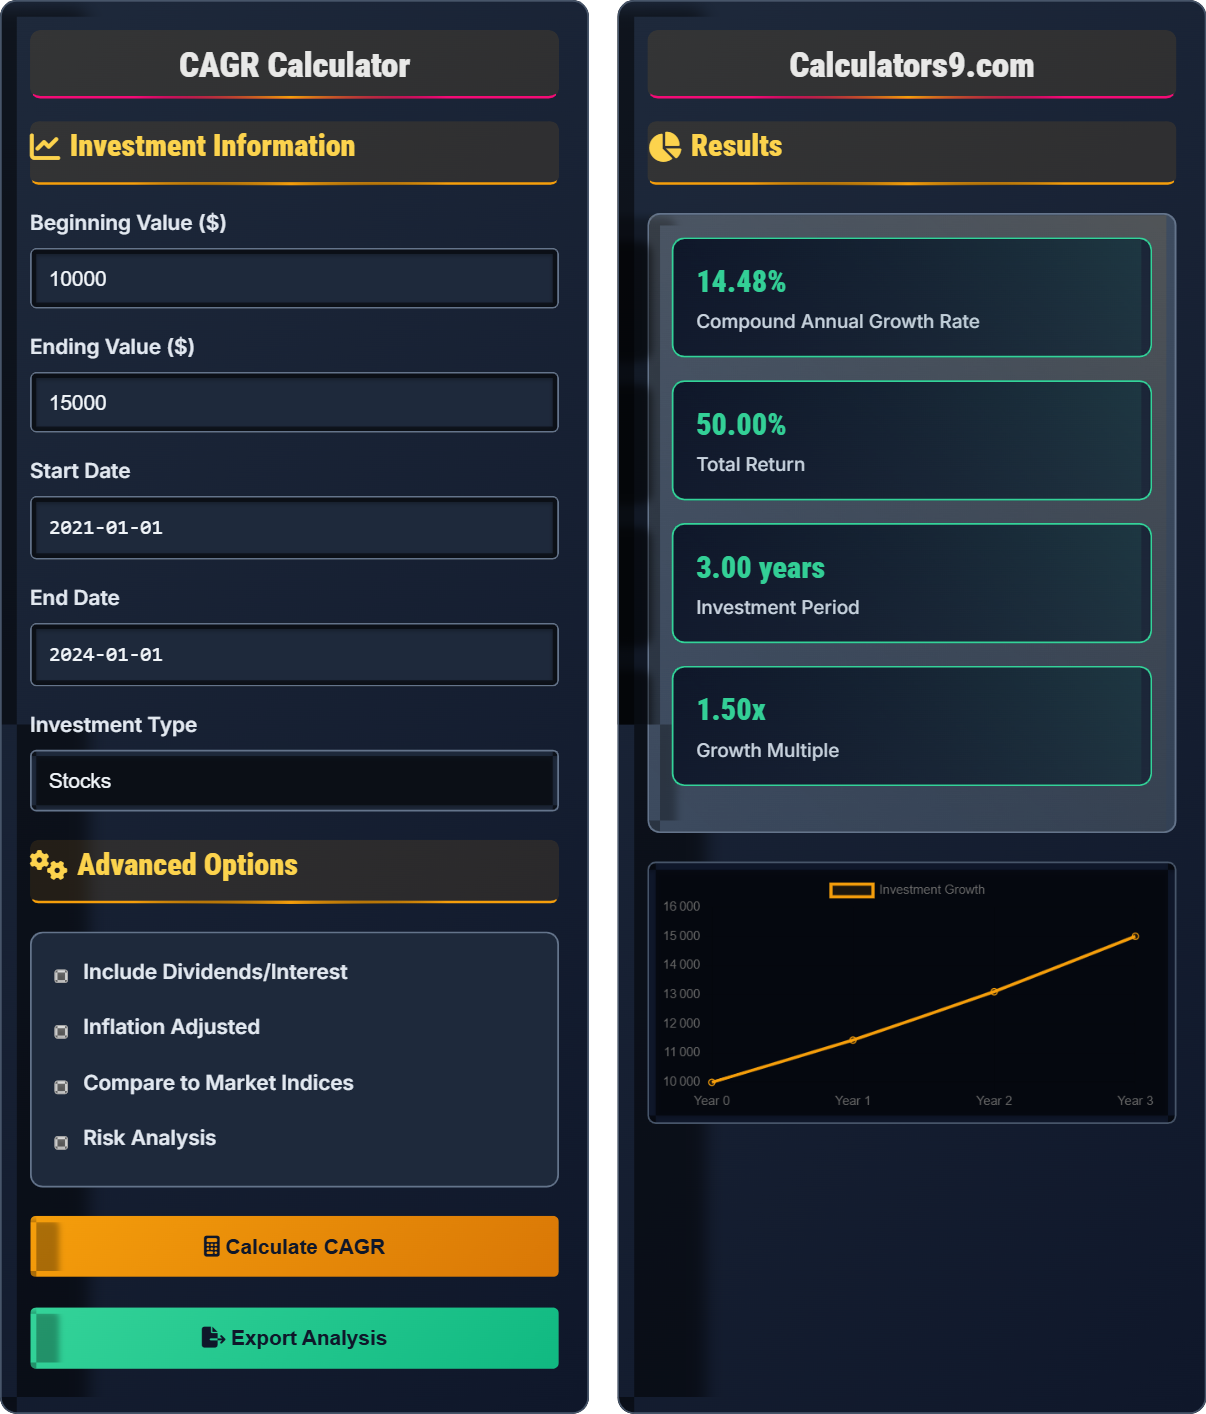
Example: If an investment grew from $10,000 to $15,000 over 3 years, the CAGR would be ($15,000 ÷ $10,000)^(1÷3) - 1 = 14.47%.
Investment Information
Advanced Options
Results
| Metric | Value | Description |
|---|---|---|
| Beginning Value | $10,000.00 | Initial investment amount |
| Ending Value | $15,000.00 | Final investment value |
| Time Period | 3.00 years | Investment duration |
| Total Return | 50.00% | Overall percentage gain |
| CAGR | 14.47% | Smoothed annual growth rate |
| Investment | CAGR | Performance |
|---|---|---|
| Your Investment | 14.47% | Outperformed |
| S&P 500 | 10.50% | Benchmark |
| Bond Index | 3.20% | Lower Risk |
| Real Estate | 7.80% | Alternative |
Comprehensive CAGR Investment Guide
Compound Annual Growth Rate (CAGR) is a business and investing term that represents the smoothed annualized gain of an investment over a given time period. Unlike simple average returns, CAGR smooths out the effects of volatility and provides a geometric progression ratio that represents a steady rate of return over time.
The CAGR formula is: CAGR = (End Value ÷ Beginning Value)^(1 ÷ Number of Years) - 1
Where:
- EV: Ending value of the investment
- BV: Beginning value of the investment
- n: Number of years
- CAGR: Compound Annual Growth Rate (expressed as a decimal)
Key differences and applications:
- CAGR vs. Arithmetic Mean: CAGR accounts for compounding, while arithmetic mean doesn't
- CAGR vs. Total Return: CAGR normalizes returns over time, total return shows absolute gain
- CAGR vs. IRR: CAGR assumes a single beginning and ending value, IRR handles multiple cash flows
- CAGR Limitations: Doesn't reflect volatility or timing of returns
- Use Appropriate Timeframes: Avoid very short periods that may not reflect true trends
- Consider Volatility: CAGR doesn't show the path of returns
- Adjust for Inflation: Calculate real CAGR for purchasing power
- Compare with Benchmarks: Evaluate against relevant market indices
- Consider Risk: Higher CAGR may come with higher volatility
CAGR Basics
The geometric progression ratio that provides a smoothed rate of return over time.
\( \text{CAGR} = \left(\frac{\text{EV}}{\text{BV}}\right)^{\frac{1}{n}} - 1 \)
Where EV is ending value, BV is beginning value, and n is number of years.
- Use for multi-year periods
- Doesn't reflect volatility
- Compounds returns annually
Analysis
Adjust CAGR for inflation to understand purchasing power growth.
- CAGR
- Total return
- Volatility
- Risk-adjusted returns
- Time period length
- Market conditions
- Risk factors
- Benchmark comparisons
CAGR Investment Learning Quiz
Which of the following best describes what CAGR measures?
The answer is B) The smoothed annualized growth rate. CAGR (Compound Annual Growth Rate) represents the steady rate of return that would be required for an investment to grow from its beginning value to its ending value over the specified time period, assuming the growth occurred at a consistent rate each year. Unlike the simple average of annual returns, CAGR accounts for the compounding effect of growth over time.
CAGR is a powerful tool for investment analysis because it smooths out the effects of volatility and provides a geometric progression ratio that represents a steady rate of return. It's particularly useful for comparing investments over different time periods because it normalizes returns to an annual basis. The key concept is that CAGR shows what the investment would have grown at each year to achieve the total return, even though the actual returns may have varied significantly year to year.
CAGR: Compound Annual Growth Rate - smoothed annualized growth rate
Compounding: Earning returns on both principal and accumulated returns
Geometric Progression: Growth pattern where each term is multiplied by a constant factor
• CAGR accounts for compounding effects
• Does not reflect volatility or timing of returns
• Useful for comparing investments over time
• Use CAGR to compare investments with different timeframes
• Consider volatility alongside CAGR
• Adjust for inflation to get real returns
• Confusing CAGR with simple average returns
• Not considering the time period when interpreting CAGR
If an investment grows from $5,000 to $8,500 over 4 years, what is the CAGR? Show your work and explain what this CAGR means in practical terms.
Calculation:
CAGR = (Ending Value ÷ Beginning Value)^(1 ÷ Number of Years) - 1
CAGR = ($8,500 ÷ $5,000)^(1 ÷ 4) - 1
CAGR = (1.7)^(0.25) - 1
CAGR = 1.1418 - 1
CAGR = 0.1418 or 14.18%
Practical Meaning:
This means that the investment grew at an average annual rate of 14.18% over the 4-year period. If the investment had grown at exactly 14.18% each year, it would have reached $8,500 from $5,000 in 4 years. This is a smoothed rate that doesn't reflect the actual year-to-year variations in returns.
This calculation demonstrates how CAGR represents the geometric mean return over time. The formula raises the total growth ratio to the power of 1 divided by the number of years, then subtracts 1. This calculation accounts for the compounding effect of returns over time. The resulting 14.18% represents the constant annual growth rate that would produce the same final value, smoothing out any volatility in the actual returns.
Geometric Mean: The average rate of return that accounts for compounding
Compounding: The process of earning returns on both principal and accumulated returns
Smoothing: The effect of averaging returns over time to eliminate volatility
• Divide by number of years in exponent
• Subtract 1 from final result
• Express as percentage for reporting
• Use the formula: (EV/BV)^(1/n) - 1
• Convert to percentage by multiplying by 100
• Verify by calculating forward: BV × (1+CAGR)^n = EV
• Forgetting to raise to the power of 1/n
• Not subtracting 1 from the result
• Confusing numerator and denominator
FAQ
Q: What's the difference between CAGR and arithmetic mean return, and why does it matter for investment analysis?
A: The key difference lies in how they handle compounding:
Arithmetic Mean: Simple average = Sum of returns ÷ Number of periods
CAGR: Geometric mean = (Ending Value ÷ Beginning Value)^(1/n) - 1
For example, if an investment returns 100% in year 1 and -50% in year 2:
Arithmetic Mean = (100% + (-50%)) ÷ 2 = 25%
CAGR = ($1,000 to $1,000)^(1/2) - 1 = 0%
The arithmetic mean suggests a positive return, but the investor broke even! CAGR correctly shows 0% growth. This matters because investments compound over time, making geometric mean (CAGR) the accurate measure of growth. The formula for the difference is: Arithmetic Mean > Geometric Mean (CAGR), with the gap increasing with volatility.
Q: How do I interpret CAGR in relation to risk and volatility?
A: CAGR has important limitations regarding risk:
CAGR Formula: CAGR = (EV ÷ BV)^(1/n) - 1
CAGR only shows the smoothed annual growth rate and doesn't reveal volatility. Two investments can have identical CAGRs but vastly different risk profiles. For example, Investment A: 10%, 10%, 10% (stable) vs. Investment B: 30%, -10%, 10% (volatile) both have 10% CAGR.
To assess risk-adjusted returns, use additional metrics:
Sharpe Ratio: (CAGR - Risk-Free Rate) ÷ Standard Deviation
Sortino Ratio: Uses downside deviation instead of total volatility
Calmar Ratio: CAGR ÷ Maximum Drawdown
Always consider CAGR alongside volatility measures to understand the full risk-return profile of an investment.