Dividend Yield Calculator
Investment analysis • 2026 portfolio tool
Dividend Yield Formula:
Show CalculatorThe dividend yield is calculated as: Dividend Yield = (Annual Dividends Per Share ÷ Price Per Share) × 100%
This metric measures the annual return on investment from dividends alone, expressed as a percentage. It's a key indicator for income-focused investors evaluating the attractiveness of dividend-paying stocks.
For portfolio analysis, the weighted average dividend yield is calculated as:
- Weighted Yield = Σ(Stock Value × Dividend Yield) ÷ Total Portfolio Value
- Annual Dividend Income = Number of Shares × Annual Dividend Per Share
- Dividend Growth Rate = (Current Dividend ÷ Previous Dividend)^(1/n) - 1
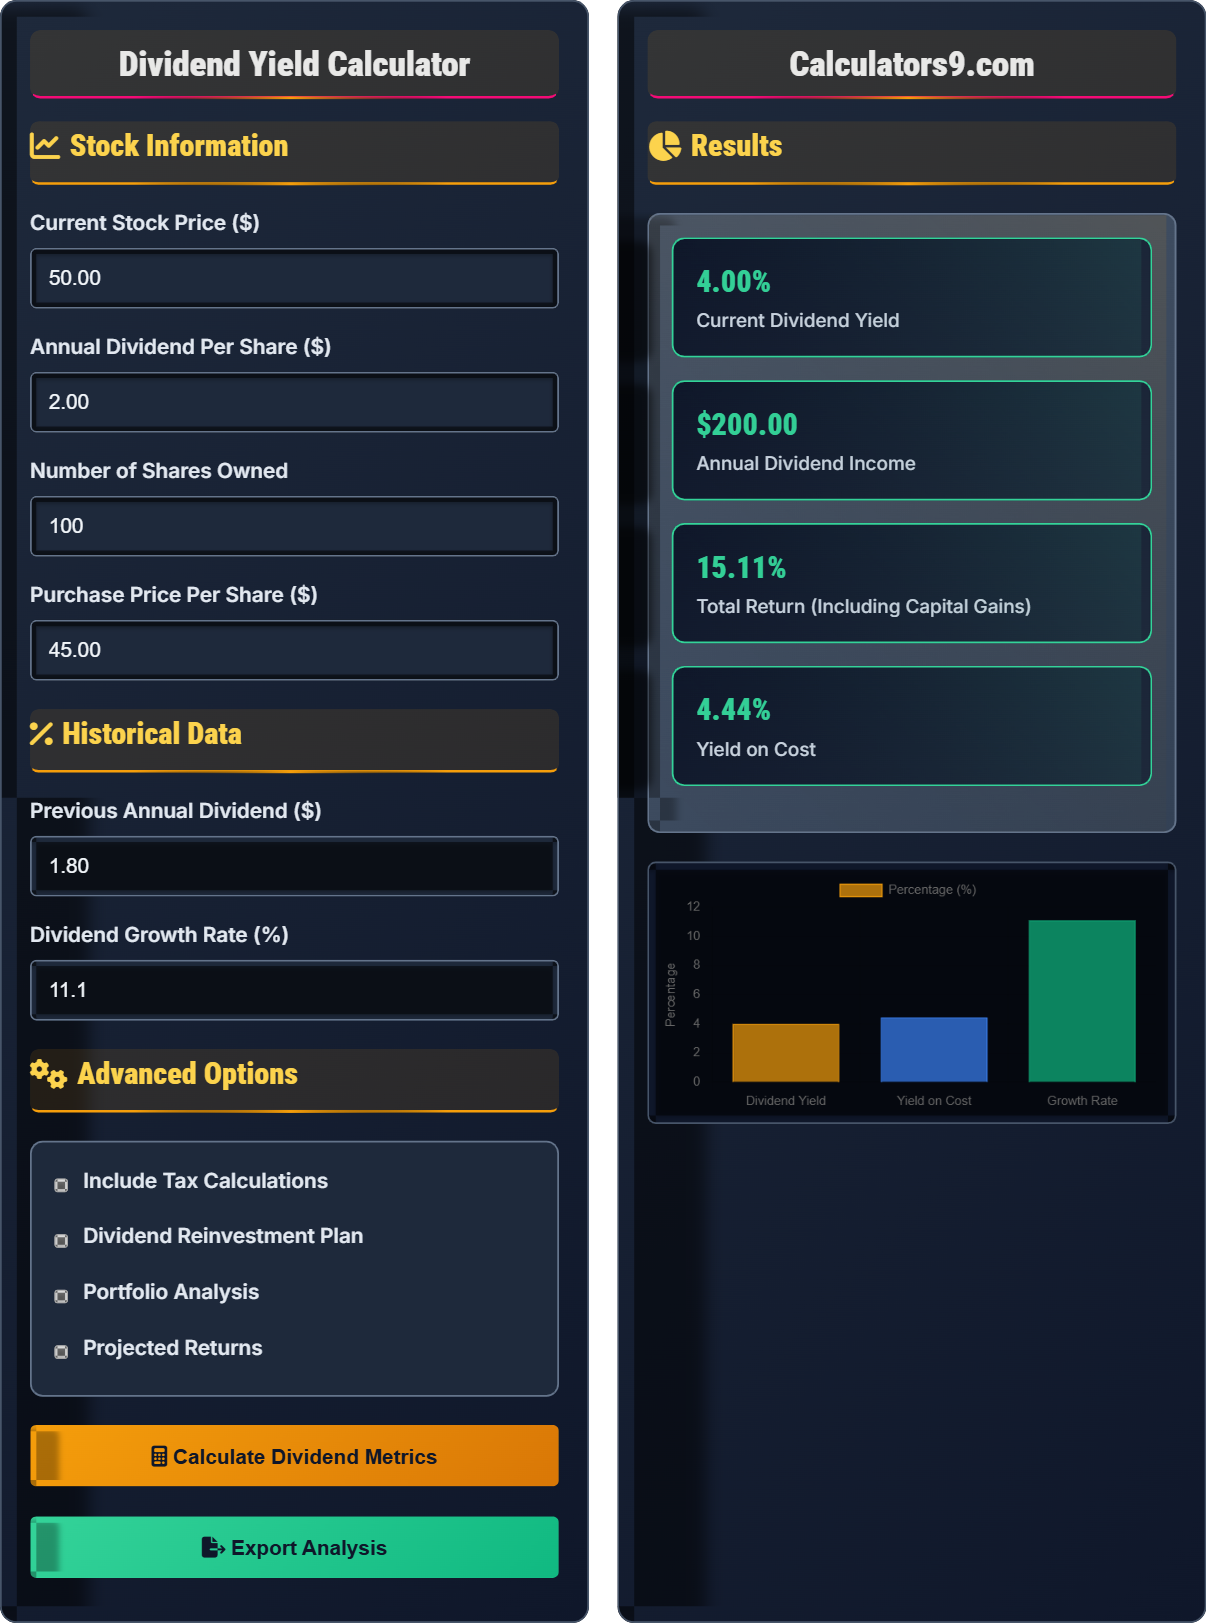
Example: If a stock pays $2.00 annually in dividends and trades at $50 per share, the dividend yield is (2.00 ÷ 50) × 100% = 4.0%.
Stock Information
Historical Data
Advanced Options
Results
| Metric | Value | Description |
|---|---|---|
| Dividend Yield | 4.00% | Annual dividend as % of current price |
| Yield on Cost | 4.44% | Annual dividend as % of purchase price |
| Dividend Growth Rate | 11.1% | Year-over-year dividend increase |
| Annual Income | $200.00 | Total dividends for 100 shares |
| Capital Gain | 11.11% | Gain since purchase |
| Period | Projected Dividend | Annual Income |
|---|---|---|
| Next Year | $2.22 | $222.00 |
| Year 2 | $2.47 | $247.00 |
| Year 3 | $2.74 | $274.00 |
| Year 5 | $3.39 | $339.00 |
| Year 10 | $5.28 | $528.00 |
Comprehensive Dividend Investment Guide
Dividend yield represents the annual return on investment from dividends alone, expressed as a percentage. It's calculated by dividing the annual dividends per share by the current stock price. This metric helps investors evaluate the income-generating potential of dividend-paying stocks relative to their current market value.
Key dividend metrics are calculated using these formulas:
Where:
- Annual Dividends Per Share: Total dividends paid per share over a year
- Price Per Share: Current market price of the stock
- Purchase Price Per Share: Original cost basis for the investment
Key metrics for evaluating dividend stocks:
- Dividend Payout Ratio: Dividends ÷ Earnings (should be sustainable, typically under 70%)
- Dividend Coverage Ratio: Earnings ÷ Dividends (measures ability to maintain payments)
- Dividend Growth Rate: Year-over-year dividend increases
- Dividend Sustainability: Company's financial health and ability to continue payments
- Diversification: Spread dividend investments across sectors to reduce risk
- Quality Focus: Choose companies with strong fundamentals and dividend track records
- Rebalancing: Regularly review and adjust holdings based on yield changes
- Tax Efficiency: Consider tax implications of dividend income
- Automatic Reinvestment: Use DRIPs to compound returns over time
Dividend Basics
The annual return from dividends expressed as a percentage of current stock price.
\( \text{Dividend Yield} = \frac{\text{Annual Dividends Per Share}}{\text{Price Per Share}} \times 100\% \)
Where dividends are the total annual payments per share.
- Yield above 7% may signal risk
- Consistent growth is preferred
- Check payout ratio sustainability
Analysis
Annual dividend as percentage of original purchase price, not current market value.
- Dividend yield
- Yield on cost
- Dividend growth rate
- Dividend sustainability
- Tax implications of dividends
- Inflation protection needs
- Company financial health
- Industry sector trends
Dividend Investment Learning Quiz
Which of the following best describes the difference between dividend yield and yield on cost?
The answer is A) Yield on cost uses purchase price, dividend yield uses current price. Dividend yield is calculated as annual dividends per share divided by the current market price per share, while yield on cost uses the original purchase price per share instead of the current market price. This means yield on cost reflects your personal return based on your actual purchase price, while dividend yield reflects the current market return.
Understanding the difference between these two metrics is crucial for dividend investors. Dividend yield changes with market prices, while yield on cost remains fixed based on your purchase price. For example, if you bought a stock at $40 paying $2 in annual dividends, your yield on cost is 5% regardless of whether the stock price rises to $50 or falls to $30. This distinction helps investors track their personal returns versus market returns.
Dividend Yield: Annual dividends ÷ current stock price × 100%
Yield on Cost: Annual dividends ÷ purchase price × 100%
Market Price: Current trading price of the stock
• Dividend yield fluctuates with market prices
• Yield on cost remains constant for your investment
• Both use the same dividend amount in calculation
• Track both metrics to understand performance
• Yield on cost shows your personal return
• Dividend yield shows current market opportunity
• Confusing yield on cost with dividend yield
• Using current price instead of purchase price for yield on cost
• Not considering dividend growth in calculations
An investor purchased 200 shares of a company at $30 per share. The company currently pays $1.80 per share annually in dividends and the stock trades at $45 per share. Calculate the dividend yield, yield on cost, and annual dividend income. Then explain the significance of each metric.
Calculations:
Dividend Yield = (Annual Dividend Per Share ÷ Current Price Per Share) × 100%
Dividend Yield = ($1.80 ÷ $45.00) × 100% = 4.0%
Yield on Cost = (Annual Dividend Per Share ÷ Purchase Price Per Share) × 100%
Yield on Cost = ($1.80 ÷ $30.00) × 100% = 6.0%
Annual Dividend Income = Number of Shares × Annual Dividend Per Share
Annual Dividend Income = 200 × $1.80 = $360.00
Significance:
- Dividend Yield (4.0%): Shows current market return opportunity
- Yield on Cost (6.0%): Reflects investor's personal return based on purchase price
- Annual Income ($360.00): Actual cash flow from the investment
This calculation demonstrates how different dividend metrics provide distinct insights. The investor's yield on cost (6.0%) is higher than the current market yield (4.0%) because they purchased at a lower price. This shows how timing affects personal returns. The annual income figure ($360.00) represents the actual cash flow the investor receives, which is independent of market price fluctuations. These metrics together provide a comprehensive view of the investment's performance.
Annual Dividend Per Share: Total dividends paid per share over a year
Current Market Price: Price at which the stock is currently trading
Purchase Price: Original cost basis for the investment
• Always use same time period for all calculations
• Dividend yield changes with market price
• Yield on cost is fixed based on purchase price
• Use the formula: Yield = (Dividend ÷ Price) × 100%
• Remember to multiply by number of shares for total income
• Compare yield on cost to current yield for perspective
• Using current price instead of purchase price for yield on cost
• Forgetting to multiply by number of shares for total income
• Not accounting for dividend changes over time
FAQ
Q: What's considered a good dividend yield, and how do I know if a high yield is sustainable?
A: A "good" dividend yield typically ranges from 2-4% for most developed market stocks. Yields above 7-8% may signal potential risk and require closer scrutiny. To assess sustainability, examine the dividend payout ratio:
Payout Ratio Formula: Dividends Per Share ÷ Earnings Per Share
A payout ratio below 70% indicates the company retains enough earnings to sustain operations and grow. For example, if a company earns $4.00 per share and pays $2.00 in dividends, the payout ratio is 50% ($2.00 ÷ $4.00), suggesting sustainability.
Additionally, look at the dividend coverage ratio (earnings ÷ dividends), which should be above 1.5x for safety. A company with $4.00 EPS and $2.00 dividend has a coverage ratio of 2.0x, indicating strong ability to maintain payments. Consider the company's debt levels, cash flow consistency, and dividend history as additional indicators of sustainability.
Q: How does dividend reinvestment affect long-term returns compared to taking dividends as cash?
A: Dividend reinvestment significantly amplifies long-term returns through compounding. The mathematical effect can be calculated using the future value of a growing annuity formula:
With Reinvestment: Future Value = Initial Investment × (1 + Total Return)^n
Where Total Return = Dividend Yield + Capital Appreciation Rate
Without Reinvestment: Future Value = Initial Investment × (1 + Capital Appreciation Rate)^n + (Dividends Received)
For example, with a 4% dividend yield and 6% capital appreciation (10% total return), a $10,000 investment over 20 years would grow to $67,275 with reinvestment. Without reinvestment, it would grow to $32,071 from price appreciation plus $8,000 in dividends received, totaling $40,071. The reinvestment strategy provides an additional $27,204 through compounding effect. This demonstrates the power of reinvesting dividends to accelerate wealth accumulation over long holding periods.