Stock Average Calculator
Cost basis & moving average calculator • 2026 markets
Stock Average Formula:
Show the calculator\( Average\_Cost = \frac{\sum_{i=1}^{n} (Quantity_i \times Price_i)}{\sum_{i=1}^{n} Quantity_i} \)
Where:
- \( Average\_Cost \) = Average cost per share
- \( Quantity_i \) = Number of shares purchased in transaction i
- \( Price_i \) = Price per share in transaction i
- \( n \) = Total number of transactions
This formula calculates the weighted average cost basis by taking into account both the number of shares and the purchase price for each transaction.
Example: Buying 100 shares at $50 and 200 shares at $60:
Total cost = (100 × $50) + (200 × $60) = $5,000 + $12,000 = $17,000
Total shares = 100 + 200 = 300
Average cost = $17,000 ÷ 300 = $56.67 per share
Thus, the average cost basis would be $56.67 per share.
Transaction History
Advanced Options
Results
| Date | Type | Quantity | Price | Amount | Running Avg |
|---|
| Metric | Value | Description |
|---|
Comprehensive Stock Average Guide
Stock averaging is an investment strategy that involves calculating the average cost basis of shares purchased at different times and prices. This technique, also known as dollar-cost averaging (DCA), helps smooth out the effects of market volatility by spreading purchases over time. The average cost basis is crucial for tax reporting and performance evaluation.
The stock average calculation uses the following formula:
Where:
- \(Average\_Cost\) = Average cost per share
- \(Quantity_i\) = Number of shares purchased in transaction i
- \(Price_i\) = Price per share in transaction i
- \(n\) = Total number of transactions
Key benefits of using average cost calculations:
- Risk Reduction: Spreads purchases over time, reducing impact of market timing
- Emotional Control: Removes emotion from investment decisions
- Disciplined Investing: Creates consistent investment habits
- Tax Efficiency: Provides clear cost basis for tax reporting
- Regular Intervals: Invest fixed amounts at regular intervals (monthly, quarterly)
- Price-Based: Invest more when prices are low, less when high
- Percentage-Based: Invest fixed percentage of income regardless of market conditions
- Event-Driven: Invest after market corrections or positive news events
Averaging Basics
Spreading investments over time to reduce volatility impact.
\(Average\_Cost = \frac{\sum_{i=1}^{n} (Quantity_i \times Price_i)}{\sum_{i=1}^{n} Quantity_i}\)
Where Average_Cost=cost per share, Quantity_i=shares in transaction i, Price_i=price in transaction i.
- Weighted average considers quantity and price
- Used for tax reporting
- Reduces market timing risk
Strategies
Investing fixed amounts at regular intervals.
- Regular interval investments
- Price-based adjustments
- Percentage-based allocations
- Event-driven additions
- Track all transactions
- Keep detailed records
- Understand tax implications
- Consider commission costs
Stock Average Learning Quiz
What is the primary purpose of calculating the average cost basis of stock purchases?
The answer is B) To determine cost basis for tax reporting. The average cost basis is essential for calculating capital gains or losses when selling stocks, which is required for tax purposes. It represents the average price paid per share, including any commissions or fees.
The average cost basis is a critical concept in tax reporting. When you sell stocks, you need to know the original cost to calculate whether you made a profit or loss. The average cost method provides a way to account for multiple purchases at different prices, giving you an accurate picture of your investment cost.
Cost Basis: The original value of an asset for tax purposes
Capital Gain/Loss: Profit or loss from selling an asset
Tax Reporting: Documenting gains and losses for tax purposes
• Cost basis is required for tax reporting
• Average cost considers all purchases
• Includes commissions and fees
• Keep detailed records of all transactions
• Include commissions in cost basis
• Understand your broker's cost basis method
• Forgetting to include commissions in cost basis
• Not tracking all purchase transactions
• Confusing purchase price with cost basis
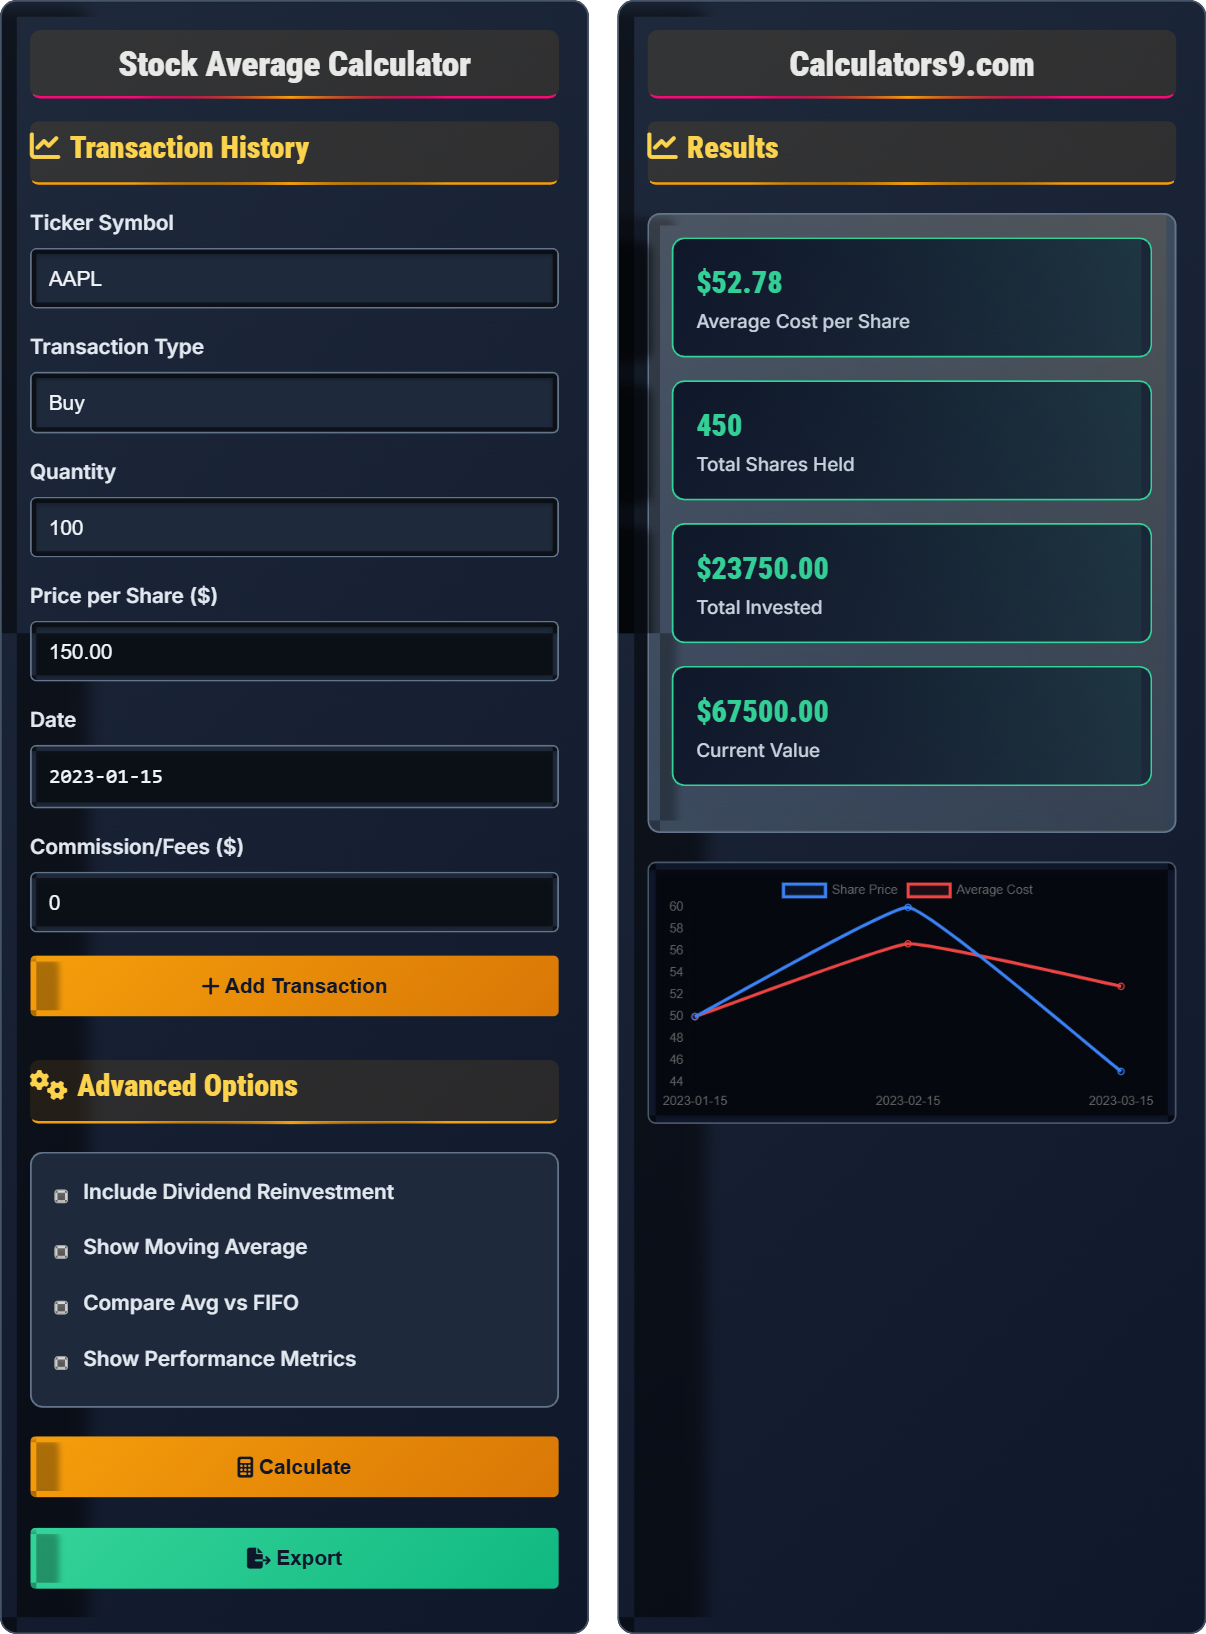
Calculate the average cost per share for these transactions: 100 shares at $50, 200 shares at $60, and 150 shares at $45. Show your work.
Step 1: Calculate total cost for each transaction
Transaction 1: 100 × $50 = $5,000
Transaction 2: 200 × $60 = $12,000
Transaction 3: 150 × $45 = $6,750
Step 2: Calculate total cost and total shares
Total cost = $5,000 + $12,000 + $6,750 = $23,750
Total shares = 100 + 200 + 150 = 450
Step 3: Calculate average cost per share
Average cost = $23,750 ÷ 450 = $52.78 per share
Therefore, the average cost per share is $52.78.
This calculation demonstrates the weighted average method, where each transaction's impact on the average depends on both the price and the number of shares purchased. The more shares you buy at a particular price, the more that price influences the overall average.
Weighted Average: Average that considers the relative importance of each value
Cost Basis: Original purchase price for tax purposes
Transaction History: Record of all buy/sell activities
• Multiply quantity by price for each transaction
• Sum all costs and all quantities
• Divide total cost by total shares
• Organize transactions in a table
• Double-check your arithmetic
• Consider using spreadsheet for multiple transactions
• Adding prices instead of weighting by quantity
• Forgetting to include all transactions
• Arithmetic errors in division
Sarah invests $1,000 monthly in a stock for 4 months. The stock prices are: Month 1: $50, Month 2: $40, Month 3: $60, Month 4: $45. How many shares did she acquire and what was her average cost per share? How does this demonstrate the benefit of dollar-cost averaging?
Step 1: Calculate shares purchased each month
Month 1: $1,000 ÷ $50 = 20 shares
Month 2: $1,000 ÷ $40 = 25 shares
Month 3: $1,000 ÷ $60 = 16.67 shares
Month 4: $1,000 ÷ $45 = 22.22 shares
Step 2: Calculate total shares and total investment
Total shares = 20 + 25 + 16.67 + 22.22 = 83.89 shares
Total investment = $1,000 × 4 = $4,000
Step 3: Calculate average cost per share
Average cost = $4,000 ÷ 83.89 = $47.68 per share
Benefit: Sarah bought more shares when prices were low (Month 2: 25 shares) and fewer when prices were high (Month 3: 16.67 shares), resulting in a lower average cost ($47.68) than the simple average of the prices ($48.75).
This example perfectly demonstrates dollar-cost averaging. By investing a fixed amount regularly, Sarah automatically bought more shares when prices were low and fewer when prices were high. This strategy reduces the impact of market timing and can result in a better average purchase price over time.
Dollar-Cost Averaging (DCA): Investing fixed amounts at regular intervals
Market Timing: Attempting to predict market movements
Volatility Smoothing: Reducing impact of price fluctuations
• Fixed investment amount at regular intervals
• Buys more shares when prices are low
• Reduces timing risk
• Set up automatic monthly investments
• Stay consistent with investment schedule
• Focus on long-term strategy
• Stopping during market downturns
• Changing investment amounts based on market
• Not maintaining consistent schedule
Tom bought 100 shares of XYZ stock at $40 in January, 150 shares at $50 in March, and 200 shares at $45 in June. He sells 250 shares in August when the price is $55. Using the average cost method, what is his gain or loss? How does this compare to FIFO method?
Step 1: Calculate average cost basis
Total cost = (100 × $40) + (150 × $50) + (200 × $45) = $4,000 + $7,500 + $9,000 = $20,500
Total shares = 100 + 150 + 200 = 450
Average cost per share = $20,500 ÷ 450 = $45.56
Step 2: Calculate gain using average cost method
Cost of 250 shares sold = 250 × $45.56 = $11,390
Proceeds from sale = 250 × $55 = $13,750
Gain = $13,750 - $11,390 = $2,360
Step 3: Calculate gain using FIFO method
FIFO: Sell 100 shares at $40 and 150 shares at $50
Cost = (100 × $40) + (150 × $50) = $4,000 + $7,500 = $11,500
Gain = $13,750 - $11,500 = $2,250
Therefore, average cost method results in $2,360 gain vs $2,250 with FIFO.
This demonstrates how different cost basis methods can affect tax liability. The average cost method uses the weighted average of all shares, while FIFO assumes the oldest shares are sold first. The choice of method can impact the amount of capital gains tax owed, though not all securities allow method selection.
Average Cost Method: Uses weighted average of all shares
FIFO: First In, First Out - oldest shares sold first
Capital Gains Tax: Tax on profits from asset sales
• Different methods can yield different tax outcomes
• Some securities restrict method selection
• Consistent record keeping is essential
• Understand your broker's default method
• Consider tax implications when selling
• Keep detailed records of all transactions
• Not understanding which method your broker uses
• Forgetting to include commissions in cost basis
• Inconsistent record keeping
Which of the following is the BEST example of dollar-cost averaging?
The answer is B) Investing $1,000 in a stock every month regardless of price. Dollar-cost averaging involves investing a fixed amount at regular intervals regardless of market conditions. This removes emotion from investment decisions and ensures you buy more shares when prices are low and fewer when prices are high.
Dollar-cost averaging is about consistency and discipline. The key characteristics are: 1) Fixed investment amount, 2) Regular intervals, and 3) Consistency regardless of market conditions. Options A, C, and D involve market timing, which is the opposite of dollar-cost averaging.
Dollar-Cost Averaging: Investing fixed amounts at regular intervals
Market Timing: Attempting to predict market movements
Investment Discipline: Consistent approach regardless of emotions
• Fixed amount at regular intervals
• No market timing involved
• Consistency is key
• Set up automatic monthly investments
• Ignore short-term market fluctuations
• Focus on long-term goals
• Stopping investments during market downturns
• Changing amounts based on market sentiment
• Confusing DCA with market timing
FAQ
Q: Can I choose which cost basis method to use for my investments?
A: The availability of cost basis methods depends on the type of security:
- Stocks: Generally must use FIFO unless you specifically identify shares sold
- Mutual Funds: Can use Average Cost method
- ETFs: Usually FIFO by default
For stocks, if you want to use a method other than FIFO, you must specifically identify which shares you're selling and notify your broker before the sale. This requires detailed record keeping of purchase dates and prices for each lot of shares.
Q: Is dollar-cost averaging suitable for all market conditions?
A: Dollar-cost averaging (DCA) is most beneficial in volatile or declining markets. In consistently rising markets, lump-sum investing typically outperforms DCA because money is invested sooner.
However, DCA provides several advantages:
- Reduces timing risk: You don't need to predict market movements
- Emotional control: Removes emotion from investment decisions
- Disciplined approach: Creates consistent investment habits
Studies suggest DCA performs better than lump-sum investing about 60% of the time, but the difference is often small in practice.