Average Calculator
Mean, Median, Mode Calculator • 2026
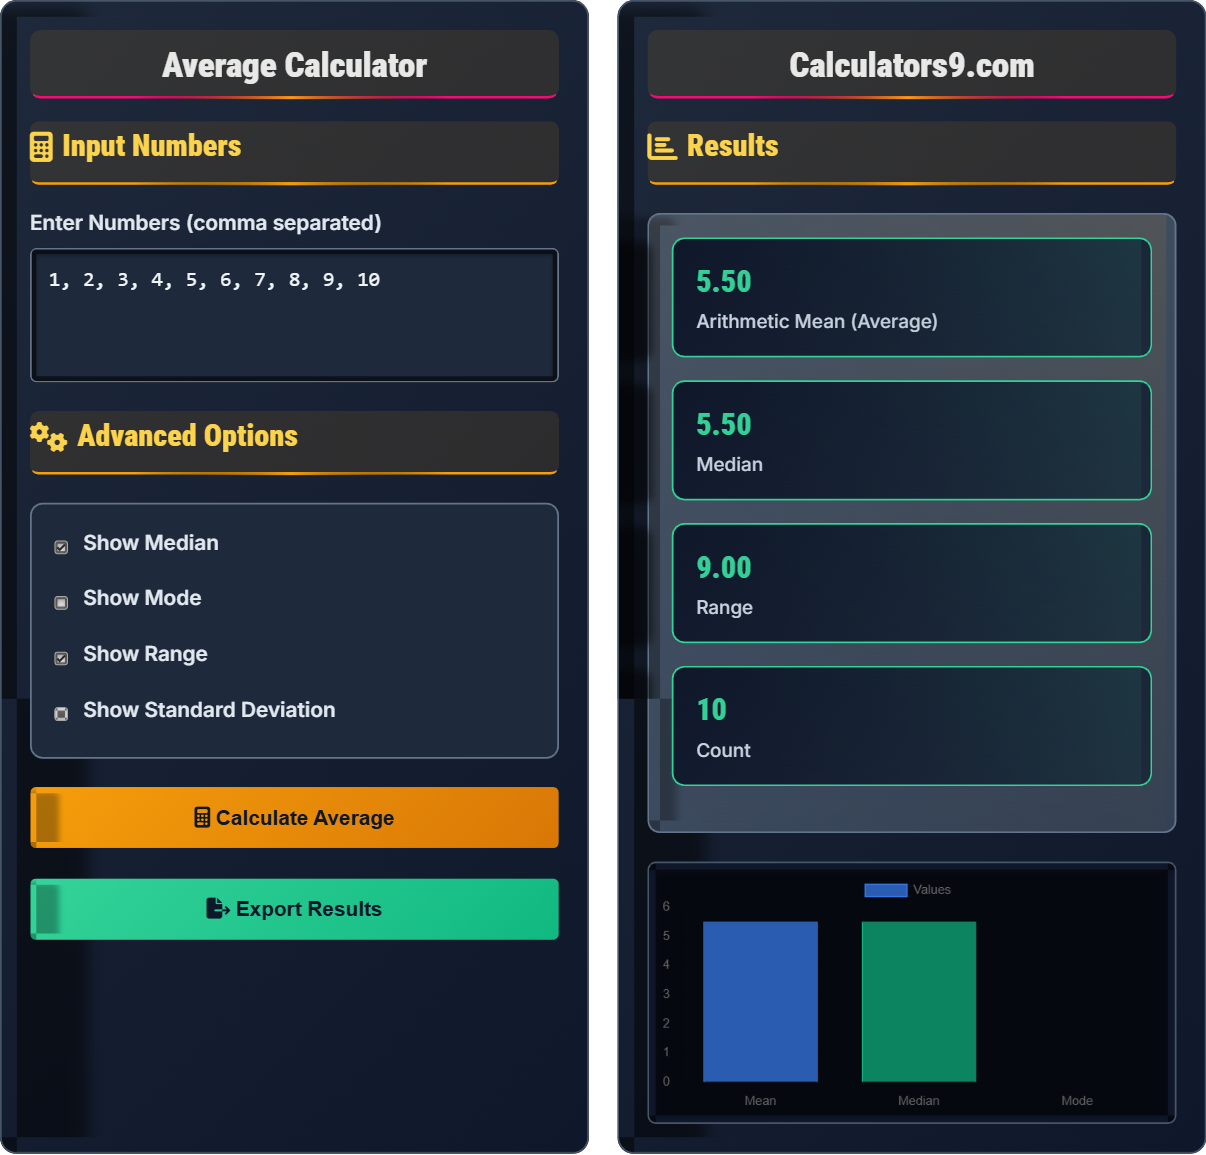
Input Numbers
Advanced Options
Results
| Index | Value | Difference from Mean |
|---|
| Position | Sorted Value | Cumulative Sum |
|---|
Comprehensive Average Guide
An average is a measure of central tendency that represents a typical value in a dataset. There are three main types of averages: mean, median, and mode. The arithmetic mean is the most commonly used average, calculated by adding all values and dividing by the number of values.
The arithmetic mean is calculated using the formula:
Where:
- \(\bar{x}\) = Arithmetic mean
- \(x_i\) = Individual values
- \(n\) = Number of values
Choose the appropriate average based on your data characteristics:
- Mean: Best for normally distributed data without extreme outliers
- Median: Best for skewed data or when outliers are present
- Mode: Best for categorical data or identifying most common values
- Geometric: Best for percentage growth or multiplicative processes
- Harmonic: Best for rates, ratios, or when dealing with speeds
- Range: Difference between maximum and minimum values
- Variance: Average of squared differences from the mean
- Standard Deviation: Square root of variance, showing spread of data
- Quartiles: Values that divide data into four equal parts
- Percentiles: Values below which a percentage of data falls
Average Learning Quiz
Which type of average is most affected by extreme values (outliers)?
The answer is A) Mean. The arithmetic mean is most affected by outliers because it incorporates every value in the dataset equally. For example, in the dataset [1, 2, 3, 4, 100], the mean is 22, while the median is 3. The outlier (100) dramatically increases the mean.
Understanding how different averages respond to outliers is crucial for data analysis. The mean uses all values in its calculation, making it sensitive to extreme values. The median, being the middle value, is resistant to outliers. The mode, representing the most frequent value, is also less affected by extreme values unless they occur frequently.
Outlier: A data point that is significantly different from other observations
Mean: Sum of all values divided by the count of values
Median: Middle value when data is ordered from least to greatest
• Mean is sensitive to all values in the dataset
• Median is resistant to outliers
• Mode is determined by frequency, not magnitude
• Remember: Mean = "affected by all" (sensitive to outliers)
• Median = "middle" (resistant to outliers)
• Mode = "most common" (frequency-based)
• Assuming all averages are equally affected by outliers
• Using mean for datasets with extreme values without considering alternatives
• Confusing the sensitivity of different averages to outliers
Calculate the arithmetic mean of the numbers: 15, 20, 25, 30, 35. Show your work.
Using the mean formula: \(\bar{x} = \frac{\sum_{i=1}^{n} x_i}{n}\)
Step 1: Add all values: 15 + 20 + 25 + 30 + 35 = 125
Step 2: Count the values: n = 5
Step 3: Divide sum by count: 125 ÷ 5 = 25
Therefore, the mean is 25.
This problem demonstrates the straightforward calculation of the arithmetic mean. The process involves summing all values and dividing by the count. This simple procedure gives equal weight to each value, which is why the mean represents the "balancing point" of the data distribution.
Arithmetic Mean: Sum of values divided by the number of values
Summation: The process of adding all values together
Count: The total number of values in the dataset
• Always add all values before dividing
• Count must match the number of values added
• Mean is expressed in the same units as the original data
• Double-check your addition to avoid calculation errors
• Verify that your count matches the number of values
• Round appropriately based on the context
• Forgetting to divide by the count after adding values
• Miscounting the number of values in the dataset
• Adding only some values instead of all values
A student received the following test scores: 85, 92, 78, 96, 89. What is the average score? If the student wants an overall average of 90 across 6 tests, what score must they achieve on their next test?
Part 1: Current average
Step 1: Add scores: 85 + 92 + 78 + 96 + 89 = 440
Step 2: Divide by number of tests: 440 ÷ 5 = 88
Current average is 88.
Part 2: Required score for 90 average
Step 1: Total needed for 6 tests: 90 × 6 = 540
Step 2: Subtract current total: 540 - 440 = 100
The student needs a score of 100 on their next test.
This problem combines average calculation with algebraic thinking. First, we calculate the current average. Then, we work backwards to find what score is needed to achieve a target average. This demonstrates how averages can be used for planning and goal-setting.
Average Score: Sum of all scores divided by the number of tests
Target Average: The desired average to achieveRequired Score: The value needed to reach a target average
• Average = Total sum ÷ Number of items
• To find required value: Target total - Current total
• Always verify calculations with reverse operations
• Use algebra: (Current total + New score) ÷ New count = Target average
• Rearrange to find required score: New score = (Target × New count) - Current total
• Check your answer by recalculating the average
• Forgetting to include the new test in the count when calculating required score
• Adding instead of multiplying when finding the target total
• Not verifying the final answer
A course grade is determined by homework (30%), midterm exam (30%), and final exam (40%). If a student scores 85 on homework, 78 on the midterm, and 92 on the final, what is their weighted average? How does this differ from the arithmetic mean of these three scores?
Step 1: Calculate weighted average
Homework contribution: 85 × 0.30 = 25.5
Midterm contribution: 78 × 0.30 = 23.4
Final contribution: 92 × 0.40 = 36.8
Weighted average: 25.5 + 23.4 + 36.8 = 85.7
Step 2: Calculate arithmetic mean
Arithmetic mean: (85 + 78 + 92) ÷ 3 = 255 ÷ 3 = 85
The weighted average is 85.7, while the arithmetic mean is 85. The weighted average is higher because the final exam (highest score) has the highest weight.
This demonstrates how weighted averages account for the relative importance of different components. Unlike the arithmetic mean where all values contribute equally, weighted averages give more influence to components with higher weights. This is commonly used in grading systems, investment portfolios, and business metrics.
Weighted Average: Average where each value has a specific weight or importance
Weight: The relative importance or contribution of each value
Contribution: Value multiplied by its weight
• Sum of all weights must equal 1 (or 100%)
• Multiply each value by its weight
• Add all weighted contributions
• Convert percentages to decimals (30% = 0.30)
• Higher weights pull the average toward those values
• Always verify that weights sum to 1
• Forgetting to convert percentages to decimals
• Adding values before multiplying by weights
• Not accounting for different weights when comparing to arithmetic mean
For the dataset [3, 5, 7, 7, 9, 11], what are the median and mode?
The answer is A) Median = 7, Mode = 7. For the median, since there are 6 values (even number), we take the average of the 3rd and 4th values: (7 + 7) ÷ 2 = 7. For the mode, 7 appears twice (more than any other value), so the mode is 7.
This problem tests understanding of both median and mode. For median with an even number of values, we average the two middle values. The mode is simply the most frequently occurring value. In this case, both measures equal 7, though they're calculated differently.
Median: Middle value when data is ordered (average of two middle values for even count)
Mode: Value that occurs most frequently
Frequency: How often a value appears in the dataset
• For even number of values, median = average of two middle values
• Mode is the most frequent value
• Dataset can have multiple modes or no mode
• Always order data before finding median
• Count frequencies to find mode
• Remember: median is positional, mode is frequency-based
• Forgetting to order data before finding median
• Choosing the middle position instead of averaging for even counts
• Confusing mode with median or mean
Average Basics
Measure of central tendency representing a typical value in a dataset.
\(\bar{x} = \frac{\sum_{i=1}^{n} x_i}{n}\)
Where \(\bar{x}\)=mean, \(\sum x_i\)=sum of values, n=count of values.
- Mean uses all values equally
- Median is resistant to outliers
- Mode shows most common value
Applications
Mean for normal distributions, median for skewed data, mode for categorical data.
- Add all values
- Count the values
- Divide sum by count
- Verify result
- Check for outliers
- Consider data distribution
- Choose appropriate average type
- Round appropriately
FAQ
Q: When should I use median vs mean?
A: Use median for skewed data or when outliers are present. For example, household income: median = $68K, mean = $97K due to high earners pulling average up.
Q: Can a dataset have no mode?
A: Yes! If all values appear with equal frequency, there is no mode. Example: [1, 2, 3, 4, 5] - each value appears once, so no mode exists.