Hypothesis Testing Tool
Statistical significance calculator • Z-test & T-test
Hypothesis Testing Formula:
Show the calculator\( z = \frac{\bar{x} - \mu_0}{\sigma/\sqrt{n}} \) (Z-test)
\( t = \frac{\bar{x} - \mu_0}{s/\sqrt{n}} \) (T-test)
Where:
- \( \bar{x} \) = sample mean
- \( \mu_0 \) = hypothesized population mean
- \( \sigma \) = population standard deviation (for z-test)
- \( s \) = sample standard deviation (for t-test)
- \( n \) = sample size
Hypothesis testing determines whether there is enough evidence to reject the null hypothesis in favor of the alternative hypothesis at a specified significance level.
Example: Testing if a sample mean differs significantly from a known population mean with \( \alpha = 0.05 \).
Test Parameters
Advanced Options
Test Results
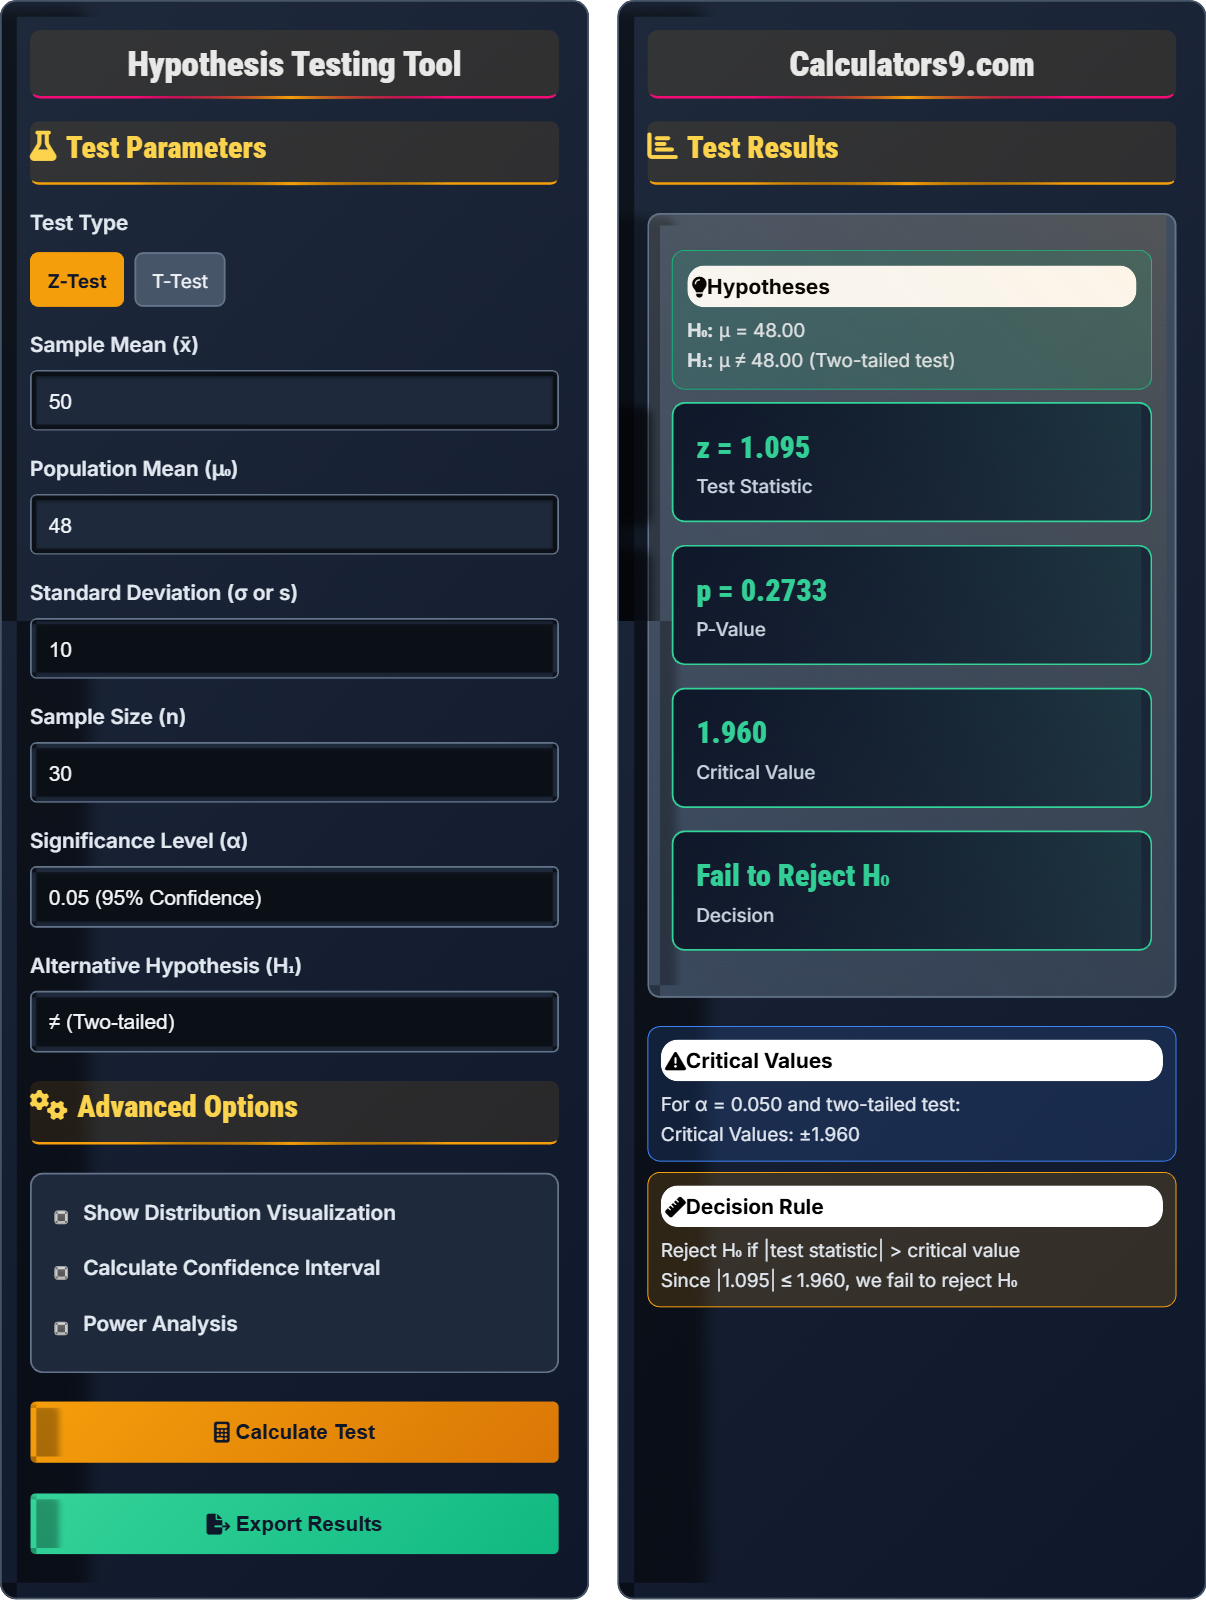
H₀: μ = 48
H₁: μ ≠ 48 (Two-tailed test)
For α = 0.05 and two-tailed test:
Critical Values: ±1.96
Reject H₀ if |test statistic| > critical value
Since |1.095| ≤ 1.96, we fail to reject H₀
Hypothesis Testing Fundamentals
Statistical method to determine if there's sufficient evidence to reject a null hypothesis about a population parameter.
Z-Test: \( z = \frac{\bar{x} - \mu_0}{\sigma/\sqrt{n}} \)
T-Test: \( t = \frac{\bar{x} - \mu_0}{s/\sqrt{n}} \)
Where \(\bar{x}\) = sample mean, \(\mu_0\) = hypothesized mean, \(\sigma\) = population std dev, \(s\) = sample std dev, \(n\) = sample size
- Null hypothesis (H₀) assumes no effect
- Alternative hypothesis (H₁) challenges H₀
- P-value indicates probability of observing result if H₀ is true
- If p ≤ α, reject H₀
Test Types & Applications
Z-test: Population standard deviation known, large samples (n ≥ 30). T-test: Population std dev unknown, small samples.
- State H₀ and H₁
- Choose significance level (α)
- Calculate test statistic
- Determine critical value/p-value
- Make decision
- Draw conclusion
- Check assumptions (normality, independence)
- Consider sample size requirements
- Interpret practical significance
- Report effect size along with p-value
Hypothesis Testing Learning Quiz
In a hypothesis test with α = 0.05, if the p-value is 0.03, what should we conclude?
The answer is C) Reject the null hypothesis. In hypothesis testing, if the p-value is less than or equal to the significance level (α), we reject the null hypothesis. Here, p = 0.03 < α = 0.05, so we reject H₀.
The p-value represents the probability of obtaining a test statistic as extreme or more extreme than the observed value, assuming the null hypothesis is true. A small p-value (≤ α) suggests that the observed data is unlikely under H₀, providing evidence against it.
P-value: Probability of observing results as extreme as the test statistic, given that H₀ is true
Significance level (α): Threshold for rejecting H₀ (typically 0.05 or 0.01)
Type I Error: Rejecting H₀ when it's actually true
• If p-value ≤ α, reject H₀
• If p-value > α, fail to reject H₀
• We never "accept" H₀, only fail to reject it
• Remember: p ≤ α means significant result
• Use the phrase "reject/fail to reject" not "accept"
• Confusing p-value with probability that H₀ is true
• Interpreting p-value as the probability of Type I error
• Accepting H₀ instead of failing to reject it
A manufacturer claims that their light bulbs have a mean lifespan of 1000 hours with a standard deviation of 100 hours. A sample of 50 bulbs has a mean lifespan of 980 hours. At α = 0.05, test the manufacturer's claim.
Step 1: State hypotheses
H₀: μ = 1000 (manufacturer's claim)
H₁: μ ≠ 1000 (two-tailed test)
Step 2: Calculate test statistic
z = (x̄ - μ₀) / (σ/√n) = (980 - 1000) / (100/√50) = -20 / (100/7.07) = -20 / 14.14 = -1.41
Step 3: Determine critical values
For α = 0.05, two-tailed test: z_critical = ±1.96
Step 4: Make decision
Since |−1.41| = 1.41 < 1.96, we fail to reject H₀
Step 5: Conclusion
There is insufficient evidence to reject the manufacturer's claim at the 0.05 significance level.
This problem demonstrates a two-tailed z-test where we're testing if the sample mean differs significantly from the claimed population mean. The key insight is that even though the sample mean (980) is numerically different from the claimed mean (1000), the difference isn't statistically significant given the sample size and variability.
Two-tailed test: Tests for differences in either direction
Standard error: σ/√n measures sampling variability
Statistical significance: Evidence strong enough to reject H₀
• Use z-test when population std dev is known
• For two-tailed test, compare |test stat| with critical value
• Always state conclusion in context of original claim
• Draw the distribution to visualize rejection regions
• Remember to divide α by 2 for two-tailed tests when finding critical values
• Using sample std dev instead of population std dev in z-test
• Forgetting to take absolute value for two-tailed test
• Not considering practical significance alongside statistical significance
FAQ
Q: When should I use a Z-test versus a T-test?
A: Use a Z-test when:
- The population standard deviation (σ) is known
- Sample size is large (n ≥ 30) OR population is normally distributed
Use a T-test when:
- The population standard deviation is unknown (use sample std dev s)
- Sample size is small (n < 30) and population may not be normal
Mathematically, the Z-statistic is: \( z = \frac{\bar{x} - \mu_0}{\sigma/\sqrt{n}} \)
And the T-statistic is: \( t = \frac{\bar{x} - \mu_0}{s/\sqrt{n}} \)
As sample size increases, the t-distribution approaches the standard normal distribution, making the choice between tests less critical for large samples.
Q: What's the relationship between p-values and confidence intervals?
A: There's a direct correspondence between hypothesis tests and confidence intervals:
If a (1-α)×100% confidence interval contains the hypothesized value (μ₀), then we fail to reject H₀ at significance level α.
If the confidence interval does NOT contain μ₀, then we reject H₀ at significance level α.
For example, with α = 0.05, if the 95% CI for μ is [46.42, 53.58] and μ₀ = 48:
Since 48 ∈ [46.42, 53.58], we fail to reject H₀.
Mathematically, for a two-sided test:
CI: \( \bar{x} \pm z_{\alpha/2} \cdot \frac{\sigma}{\sqrt{n}} \)
Reject H₀ if: \( |\bar{x} - \mu_0| > z_{\alpha/2} \cdot \frac{\sigma}{\sqrt{n}} \)
This equivalence holds because both methods use the same underlying statistical theory.