Inequality Plotter
Advanced mathematical tool • Graphing inequalities
Inequality Types & Solutions:
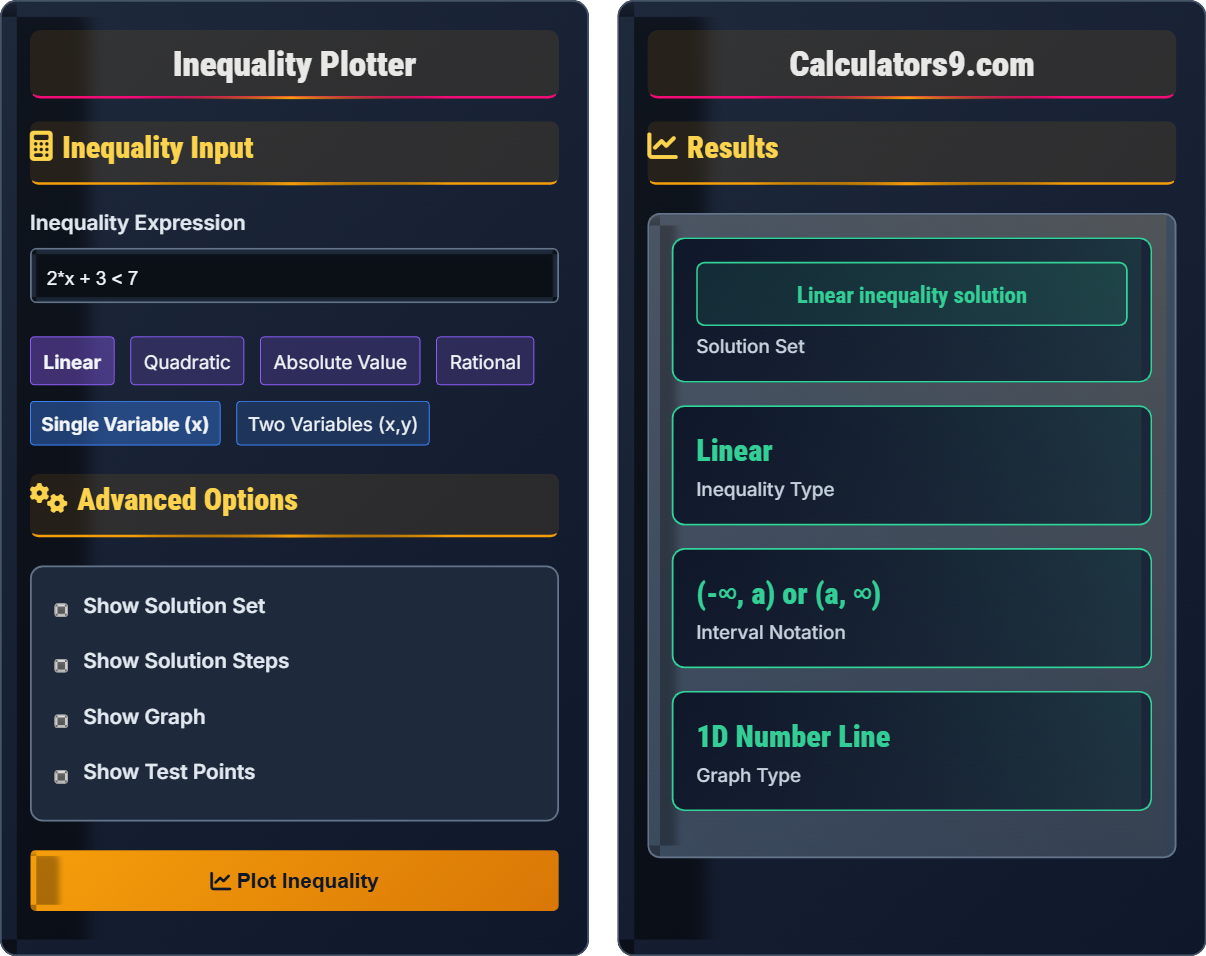
Show the calculatorLinear Inequalities: ax + b < c, ax + by < c
Quadratic Inequalities: ax² + bx + c < 0, (x - h)² + (y - k)² < r²
Rational Inequalities: P(x)/Q(x) < 0
Absolute Value: |x - a| < b
Solution Methods:
- Graphical method: shade regions satisfying inequality
- Test point method: verify which side of boundary satisfies inequality
- Interval notation: express solution sets concisely
- Sign analysis: determine where expression changes sign
Key Rules: When multiplying or dividing by negative numbers, reverse the inequality sign. For absolute value inequalities: |x| < a means -a < x < a, and |x| > a means x < -a or x > a.
Inequality Input
Advanced Options
Results
Inequality Fundamentals
An inequality is a mathematical statement that compares two expressions using inequality symbols: <, >, ≤, ≥. Unlike equations which state equality, inequalities express relationships where one expression is greater than, less than, or equal to another expression. The solution to an inequality is typically a range of values that satisfy the relationship.
-
1Linear: ax + b < c, ax + by < c
-
2Quadratic: ax² + bx + c < 0
-
Absolute Value: |x - a| < b
-
Rational: P(x)/Q(x) < 0
-
Polynomial: Higher-degree polynomials
- Reverse inequality sign when multiplying/dividing by negative numbers
- For |x| < a: -a < x < a
- For |x| > a: x < -a OR x > a
- Solutions often form intervals on the number line
Graphing Inequalities
Graphing inequalities involves shading regions of the coordinate plane that satisfy the inequality. For linear inequalities, the boundary is a line, and the solution region is on one side of the line. For quadratic inequalities, the boundary is a parabola, and the solution region is either inside or outside the parabola.
- Graph Boundary: Draw the boundary line (solid for ≤/≥, dashed for
- Test Point: Choose a point not on the boundary
- Shade Region: Shade the region containing points that satisfy the inequality
- Verify: Check that test points in shaded region satisfy the inequality
- Solid line for ≤ and ≥, dashed line for < and >
- For y > mx + b, shade above the line
- For y < mx + b, shade below the line
- Test origin (0,0) when possible
- For quadratic, test inside and outside regions
Inequality Plotting Learning Quiz
When solving the inequality -3x > 12, what is the correct solution and why?
The answer is B) x < -4 (divide both sides by -3 and flip the sign). When solving inequalities, we must reverse the inequality sign when multiplying or dividing both sides by a negative number. Starting with -3x > 12, dividing both sides by -3 gives: x < 12/(-3), which simplifies to x < -4. To verify: if x = -5, then -3(-5) = 15 > 12 .
This fundamental rule is crucial for solving inequalities. The reason for flipping the sign is that multiplying or dividing by a negative number reverses the order of numbers on the number line. For example, 3 > 2, but when multiplied by -1, we get -3 < -2. This principle must be applied consistently to maintain the truth of the inequality.
Inequality Sign Rule: Reverse the inequality when multiplying/dividing by negative numbers
Number Line Order: How multiplication by negatives affects relative positions
Verification: Checking solutions by substituting values
• Flip inequality sign when multiplying/dividing by negative numbers
• Keep inequality sign when multiplying/dividing by positive numbers
• Always verify solutions by substitution
• Remember: negative coefficient means flip the sign
• Always verify by substituting a test value
• Write the flip step explicitly to avoid mistakes
• Forgetting to flip the inequality sign
• Flipping when multiplying by positive numbers
• Not verifying the solution
Solve the inequality 2x - 5 ≤ 3x + 1 and graph the solution on a number line. Express the solution in interval notation.
Step 1: Start with 2x - 5 ≤ 3x + 1
Step 2: Subtract 2x from both sides: -5 ≤ x + 1
Step 3: Subtract 1 from both sides: -6 ≤ x
Step 4: Rewrite in standard form: x ≥ -6
Step 5: Interval notation: [-6, ∞)
Step 6: Graph on number line: closed circle at -6, arrow pointing right
Verification: Test x = -5: 2(-5) - 5 = -15 and 3(-5) + 1 = -14, so -15 ≤ -14 ✓
Therefore, the solution is x ≥ -6, or [-6, ∞) in interval notation.
This problem demonstrates the systematic approach to solving linear inequalities. We isolate the variable using inverse operations, just like with equations, but we must be careful about the inequality sign. The solution set includes all values greater than or equal to -6, which is represented with a closed bracket at -6 and an open interval extending to infinity.
Interval Notation: Way to represent solution sets using brackets and parentheses
Closed Bracket: Includes endpoint [a, b] means a ≤ x ≤ b
Open Parenthesis: Excludes endpoint (a, b) means a < x < b
• Collect variable terms on one side
• Isolate the variable
• Express solution in interval notation
• Move variable terms to the side with larger coefficient initially
• Always verify with a test value
• Use closed circles for ≤ and ≥, open circles for < and >
• Forgetting to flip sign when moving negative terms
• Using wrong bracket type in interval notation
• Not verifying the solution
A company manufactures widgets with a fixed cost of $2000 and a variable cost of $5 per widget. They sell each widget for $12. How many widgets must be sold to make a profit of at least $3000? Write and solve the inequality.
Step 1: Define variables
Let x = number of widgets sold
Step 2: Set up the profit equation
Profit = Revenue - Costs
Revenue = 12x (selling price × quantity)
Costs = 2000 + 5x (fixed + variable costs)
Profit = 12x - (2000 + 5x) = 12x - 2000 - 5x = 7x - 2000
Step 3: Write the inequality for profit ≥ $3000
7x - 2000 ≥ 3000
Step 4: Solve the inequality
7x - 2000 ≥ 3000
7x ≥ 5000
x ≥ 5000/7 ≈ 714.29
Step 5: Interpret the result
Since we can't sell a fraction of a widget, x ≥ 715 widgets
Step 6: Verify
Profit at 715 widgets: 7(715) - 2000 = 5005 - 2000 = $3005 ≥ $3000 ✓
Therefore, at least 715 widgets must be sold to achieve a profit of at least $3000.
This application problem connects linear inequalities to business concepts. The key is translating the verbal description into mathematical expressions. Profit is revenue minus costs, and we set up the inequality to ensure profit meets the minimum requirement. The solution requires rounding up since we can't sell partial units.
Profit: Revenue minus total costs
Fixed Cost: Cost that doesn't change with production volume
Variable Cost: Cost that changes with production volume
• Translate words into mathematical expressions
• Set up inequality based on minimum/maximum requirements
• Interpret results in context of the problem
• Identify what quantity represents the variable
• Express all quantities in terms of the variable
• Consider real-world constraints (whole numbers, etc.)
• Confusing revenue with profit
• Forgetting to include fixed costs
• Not interpreting the solution in context
A manufacturer specifies that the diameter of a ball bearing must be 10mm with an allowable tolerance of no more than 0.1mm. Write an absolute value inequality that represents acceptable diameters, then solve and graph the solution.
Step 1: Define the variable
Let d = diameter of the ball bearing (in mm)
Step 2: Set up the absolute value inequality
The deviation from the ideal diameter (10mm) must be at most 0.1mm
|d - 10| ≤ 0.1
Step 3: Solve the absolute value inequality
For |x| ≤ a where a > 0, the solution is -a ≤ x ≤ a
So: -0.1 ≤ d - 10 ≤ 0.1
Add 10 to all parts: -0.1 + 10 ≤ d ≤ 0.1 + 10
9.9 ≤ d ≤ 10.1
Step 4: Interval notation: [9.9, 10.1]
Step 5: Graph on number line: closed circles at 9.9 and 10.1, line segment connecting them
Step 6: Verify
At d = 9.9: |9.9 - 10| = |-0.1| = 0.1 ≤ 0.1 ✓
At d = 10.1: |10.1 - 10| = |0.1| = 0.1 ≤ 0.1 ✓
At d = 10: |10 - 10| = |0| = 0 ≤ 0.1 ✓
Therefore, acceptable diameters are between 9.9mm and 10.1mm, inclusive.
This problem demonstrates the practical application of absolute value inequalities in manufacturing tolerances. The absolute value |d - 10| represents the distance between the actual diameter and the ideal diameter. The inequality |d - 10| ≤ 0.1 means the actual diameter can deviate by at most 0.1mm from the ideal in either direction.
Absolute Value: Distance from zero on number line
Tolerance: Allowable deviation from a specified value
Manufacturing Specification: Acceptable range for product dimensions
• |x| ≤ a means -a ≤ x ≤ a
• |x| ≥ a means x ≤ -a OR x ≥ a
• Absolute value inequalities model tolerance ranges
• Absolute value inequalities often model tolerance problems
• The center value is usually the ideal/target value
• The tolerance is the maximum allowed deviation
• Forgetting that |x| ≤ a gives a double inequality
• Not considering both directions of deviation
• Misinterpreting the absolute value inequality
Which of the following represents the solution to the inequality x² - 5x + 6 > 0?
The answer is B) x ∈ (-∞, 2) ∪ (3, ∞). To solve x² - 5x + 6 > 0, first factor the quadratic: x² - 5x + 6 = (x - 2)(x - 3). The inequality becomes (x - 2)(x - 3) > 0. The zeros are x = 2 and x = 3, which divide the number line into three intervals: (-∞, 2), (2, 3), and (3, ∞). Test a point in each interval: For x = 0: (0-2)(0-3) = (-2)(-3) = 6 > 0 ✓ For x = 2.5: (2.5-2)(2.5-3) = (0.5)(-0.5) = -0.25 < 0 ✗ For x = 4: (4-2)(4-3) = (2)(1) = 2 > 0 ✓ Therefore, the solution is x ∈ (-∞, 2) ∪ (3, ∞), where the product is positive.
This problem demonstrates the sign analysis method for quadratic inequalities. We factor the quadratic, find the zeros, and test the sign of the expression in each interval. The solution consists of intervals where the expression has the required sign. Since we want the expression to be positive (> 0), we select intervals where the product of factors is positive.
Sign Analysis: Method to determine where expressions are positive/negative
Test Interval: Check sign of expression in each interval
Union of Intervals: Multiple intervals that satisfy the inequality
• Factor quadratic completely first
• Find zeros and test intervals between them
• Select intervals where expression has desired sign
• Always factor before solving quadratic inequalities
• Use test points to verify signs in intervals
• Remember: positive product requires even number of negative factors
• Forgetting to factor completely
• Testing points incorrectly
• Confusing solution for > 0 vs < 0
FAQ
Q: Why do we need to flip the inequality sign when multiplying or dividing by a negative number?
A: This happens because multiplying or dividing by a negative number reverses the order of numbers on the number line. For example, we know that 3 > 2. But if we multiply both sides by -1, we get -3 and -2. Since -3 is to the left of -2 on the number line, -3 < -2. So 3 > 2 becomes -3 < -2. The relationship flips. This is why the inequality sign must be reversed to maintain the truth of the statement. It's a fundamental property of the ordering of real numbers.
Q: How do I graph inequalities with two variables?
A: To graph inequalities with two variables:
Step 1: Graph the boundary line. Use a solid line for ≤ or ≥, and a dashed line for < or >.
Step 2: Choose a test point not on the boundary line (often (0,0) if it's not on the line).
Step 3: Substitute the test point coordinates into the inequality.
Step 4: If the inequality is true, shade the side containing the test point. If false, shade the opposite side.
Step 5: Verify by testing another point in the shaded region.
For example, for y > 2x + 1: graph y = 2x + 1 as a dashed line, test (0,0): 0 > 2(0) + 1 = 0 > 1 (false), so shade the side not containing (0,0).