Margin of Error Calculator
Statistics & probability • 2026 edition
Margin of Error Formula:
Show the calculator\( MOE = Z_{\alpha/2} \times \frac{\sigma}{\sqrt{n}} \)
Where:
- \( MOE \) = Margin of Error
- \( Z_{\alpha/2} \) = Critical Value (Z-Score)
- \( \sigma \) = Population Standard Deviation
- \( n \) = Sample Size
The margin of error quantifies the random sampling error in a survey's results. It represents the range within which the true population parameter is expected to lie, given a certain confidence level. A smaller margin of error indicates greater precision and reliability of the survey results.
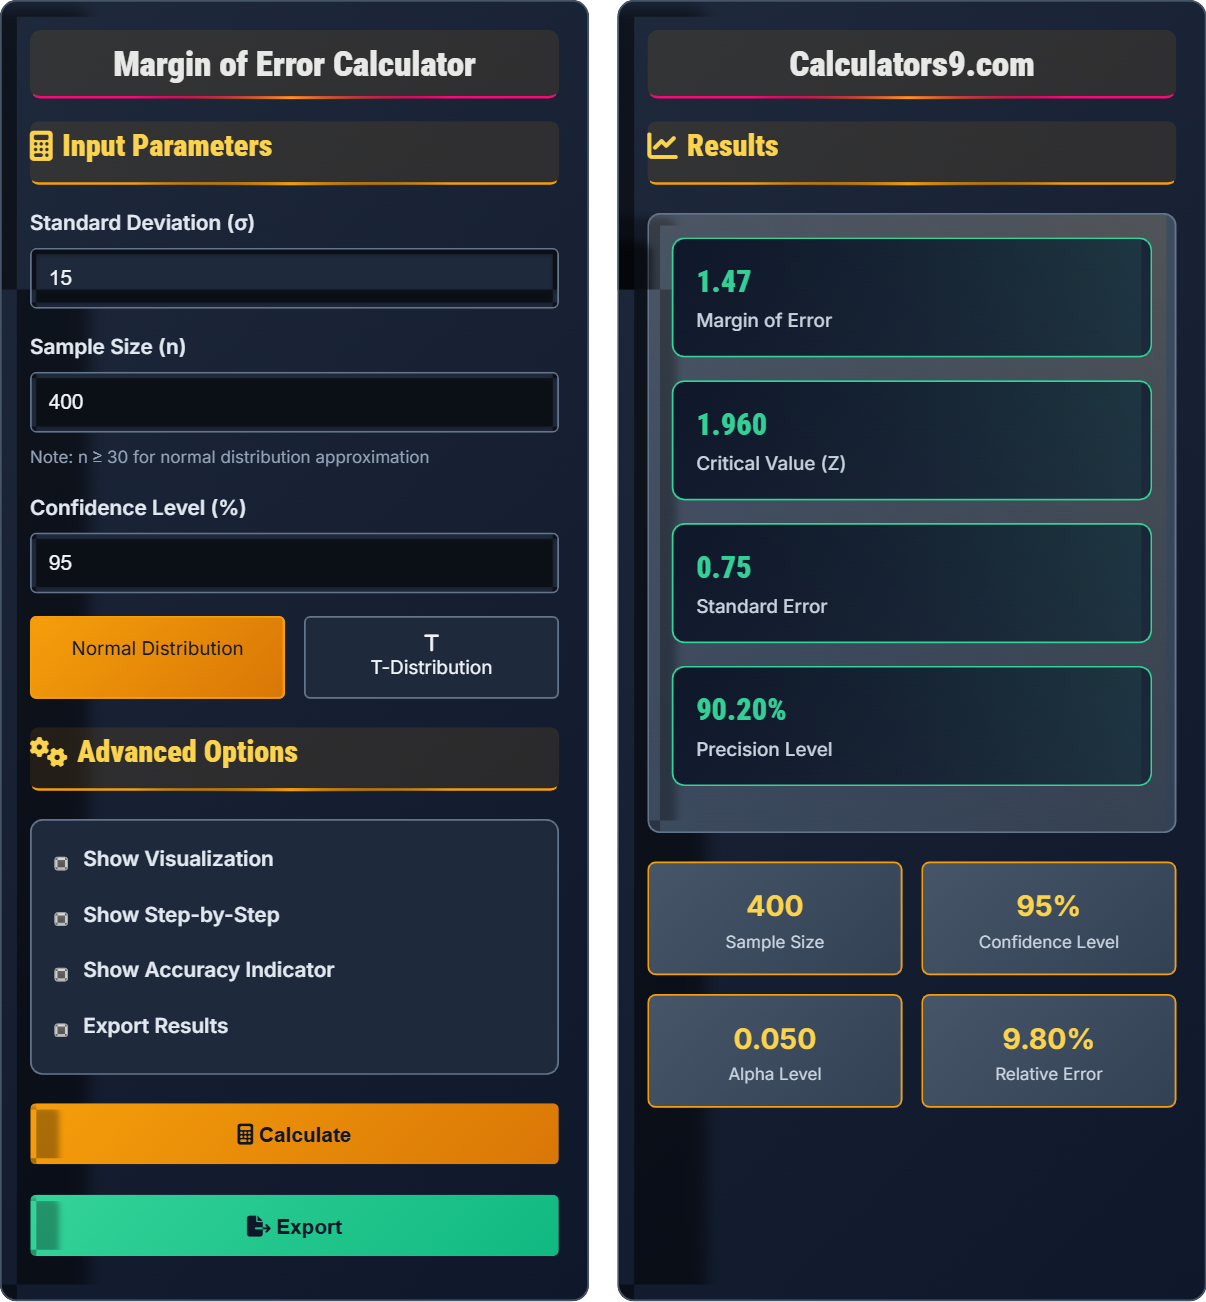
Example: For a survey with \( \sigma = 15 \), \( n = 400 \), and 95% confidence level (\( Z = 1.96 \)):
Standard Error: \( SE = \frac{15}{\sqrt{400}} = \frac{15}{20} = 0.75 \)
Margin of Error: \( MOE = 1.96 \times 0.75 = 1.47 \)
Thus, if the sample mean is 50, we can say with 95% confidence that the true population mean is between 48.53 and 51.47.
Input Parameters
Normal Distribution
T-Distribution
Advanced Options
Results
Comprehensive Statistics Guide
The margin of error is a statistic that expresses the amount of random sampling error in a survey's results. It represents the range of values above and below the sample statistic in a confidence interval. For example, if a poll reports a 50% approval rating with a 3% margin of error, the true approval rating is likely between 47% and 53%. The margin of error is influenced by the sample size, confidence level, and population variability.
The standard margin of error calculation uses the following formula:
Where:
- \(MOE\) = Margin of Error
- \(Z_{\alpha/2}\) = Critical Value (Z-Score)
- \(\sigma\) = Population Standard Deviation
- \(n\) = Sample Size
Common confidence levels and their corresponding Z-scores:
- 90% Confidence: Z = 1.645
- 95% Confidence: Z = 1.96
- 99% Confidence: Z = 2.576
- 99.9% Confidence: Z = 3.291
- Political Polling: Determining accuracy of election predictions
- Market Research: Estimating customer satisfaction or preferences
- Quality Control: Assessing product specifications and tolerances
- Medical Studies: Evaluating treatment effectiveness
- Academic Research: Reporting findings with appropriate uncertainty
Statistics Fundamentals
The range of random sampling error in survey results; indicates precision of estimates.
\(MOE = Z \times \frac{\sigma}{\sqrt{n}}\)
Where MOE=margin of error, Z=critical value, σ=std dev, n=sample size.
- Larger sample = smaller MOE
- Higher confidence = larger MOE
- Greater variability = larger MOE
Applications
Used in polling, research, quality control, medical studies, and scientific experiments.
- Assess reliability of survey results
- Determine sample size needs
- Evaluate study precision
- Report findings appropriately
- Sampling method affects validity
- Non-sampling errors not captured
- Assumes random sampling
- Population must be well-defined
Statistics Learning Quiz
Which of the following statements about margin of error is CORRECT?
The answer is B) Margin of error quantifies random sampling error in survey results. The margin of error specifically measures the uncertainty that arises from using a sample instead of the entire population. It does not measure systematic bias (which is non-sampling error), and it decreases as sample size increases.
It's important to distinguish between sampling error (what margin of error measures) and non-sampling errors. Sampling error occurs because we're using a subset of the population rather than the whole population. Non-sampling errors include things like response bias, measurement errors, or problems with the sampling frame. The margin of error only addresses the inherent uncertainty due to random sampling.
Margin of Error: The maximum expected difference between the observed sample statistic and the true population parameter
Sampling Error: Error that occurs due to the random nature of sampling
Non-Sampling Error: Errors not related to the sampling process (bias, measurement error, etc.)
• MOE only accounts for random sampling variation
• Larger samples reduce MOE
• MOE does not capture systematic biases
• Think of MOE as the "fuzziness" around your estimate
• MOE tells you how precise your sample estimate is
• Always consider both sampling and non-sampling errors
• Confusing MOE with systematic bias
• Assuming MOE captures all sources of error
• Ignoring non-sampling errors in interpretation
A market research firm surveys 625 customers and finds an average satisfaction rating of 7.2 with a known population standard deviation of 1.5. Calculate the margin of error for a 90% confidence level. Show your work.
Using the margin of error formula: \(MOE = Z \times \frac{\sigma}{\sqrt{n}}\)
Given:
- \(\sigma = 1.5\)
- \(n = 625\)
- For 90% confidence: \(Z = 1.645\)
Step 1: Calculate Standard Error: \(SE = \frac{\sigma}{\sqrt{n}} = \frac{1.5}{\sqrt{625}} = \frac{1.5}{25} = 0.06\)
Step 2: Calculate Margin of Error: \(MOE = Z \times SE = 1.645 \times 0.06 = 0.0987\)
Therefore, the margin of error is approximately 0.10.
This problem demonstrates how to apply the margin of error formula step by step. Notice that with a large sample size (n=625), the standard error becomes quite small, leading to a narrow margin of error. This shows how larger samples provide more precise estimates. The confidence level determines the critical value, which scales the standard error to achieve the desired confidence.
Standard Error: The standard deviation of the sampling distribution of a statistic
Margin of Error: The product of the critical value and the standard error
Critical Value: The number of standard deviations needed to achieve the desired confidence level
• Use Z-distribution when population std dev is known or n ≥ 30
• Use T-distribution when population std dev is unknown and n < 30
• Always check assumptions before calculating MOE
• Remember: SE = σ/√n
• MOE = Critical Value × SE
• Larger samples yield smaller MOE
• Forgetting to divide standard deviation by √n to get standard error
• Using the wrong critical value for the confidence level
• Mixing up standard deviation and standard error
A political pollster currently has a margin of error of 4% with a sample size of 625 voters. The pollster wants to reduce the margin of error to 2%. What sample size would be needed? Explain your reasoning.
The margin of error formula is: \(MOE = Z \times \frac{\sigma}{\sqrt{n}}\)
This can be rearranged to: \(MOE \propto \frac{1}{\sqrt{n}}\)
Initially: \(MOE_1 = 4\%\) with \(n_1 = 625\)
Desired: \(MOE_2 = 2\%\) with \(n_2 = ?\)
Since \(MOE \propto \frac{1}{\sqrt{n}}\), we have: \(\frac{MOE_1}{MOE_2} = \frac{\sqrt{n_2}}{\sqrt{n_1}}\)
\(\frac{4}{2} = \frac{\sqrt{n_2}}{\sqrt{625}}\)
\(2 = \frac{\sqrt{n_2}}{25}\)
\(\sqrt{n_2} = 50\)
\(n_2 = 2500\)
Therefore, the sample size must increase from 625 to 2500 voters to halve the margin of error.
This demonstrates the inverse square root relationship between sample size and margin of error. To halve the margin of error, you need to quadruple the sample size. This relationship is fundamental in survey planning and explains why achieving high precision comes at a significant cost in terms of sample size. The mathematical relationship shows that precision improvements become increasingly expensive in terms of sample size.
Margin of Error: The maximum expected difference between the observed sample statistic and the true population parameter
Sample Size: The number of observations in a sample
Precision: The degree to which a measurement is exact
• MOE ∝ 1/√n (margin of error is inversely proportional to square root of n)
• To halve the margin of error, quadruple the sample size
• Larger samples provide more precise estimates
• To double precision, multiply sample size by 4
• To triple precision, multiply sample size by 9
• The relationship follows: New MOE = Original MOE / √(multiplier for n)
• Thinking that doubling the sample size halves the margin of error
• Not accounting for the square root relationship
• Confusing the relationship between sample size and precision
A company wants to conduct a customer satisfaction survey with a margin of error of no more than 2.5% at a 95% confidence level. Based on previous studies, they estimate the population standard deviation to be 0.8. What minimum sample size should they plan for? Discuss the implications of this sample size.
We need to solve for n in the margin of error formula: \(MOE = Z \times \frac{\sigma}{\sqrt{n}}\)
Given:
- \(MOE = 0.025\) (2.5%)
- \(\sigma = 0.8\)
- For 95% confidence: \(Z = 1.96\)
Rearranging the formula: \(n = \left( \frac{Z \times \sigma}{MOE} \right)^2\)
Step 1: Calculate the ratio: \(\frac{Z \times \sigma}{MOE} = \frac{1.96 \times 0.8}{0.025} = \frac{1.568}{0.025} = 62.72\)
Step 2: Square the result: \(n = (62.72)^2 = 3933.8\)
Step 3: Round up to the nearest whole number: \(n = 3934\)
Therefore, the minimum sample size needed is 3,934 customers.
Implications: This is a large sample size that will require significant resources for data collection. However, it ensures high precision in the survey results. The company should consider the trade-off between precision and cost.
This demonstrates how to work backwards from desired precision to determine sample size. The sample size formula shows that to achieve greater precision, significantly larger samples are needed. This creates a cost-benefit trade-off that researchers must consider. The calculation also shows how the confidence level and population variability affect the required sample size.
Sample Size Calculation: Method to determine minimum sample size for desired precision
Cost-Benefit Analysis: Evaluation of trade-offs between precision and resource requirements
Survey Planning: Process of designing a survey to meet specific objectives
• Always round up sample size calculations to ensure minimum requirements
• Higher precision requirements exponentially increase sample size
• Consider practical constraints when planning surveys
• Use sample size calculators for quick estimates
• Consider stratified sampling to improve efficiency
• Plan for non-response rates when calculating final sample size
• Forgetting to round up sample size calculations
• Not accounting for non-response rates
• Ignoring practical constraints in sample size planning
Which of the following statements about confidence levels and margin of error is TRUE?
The answer is B) A 99% confidence level produces a larger margin of error than 95%. This is because higher confidence levels require larger critical values (Z scores). For example, the Z-score for 95% confidence is 1.96, while for 99% confidence it's 2.576. Since the margin of error is directly proportional to the critical value, increasing the confidence level increases the margin of error.
There's a direct trade-off between confidence level and precision (margin of error). To be more confident that our interval captures the true parameter, we must accept a wider range of possible values. This is reflected mathematically in the margin of error formula where the critical value increases with confidence level, directly increasing the margin of error. Students often expect higher confidence to mean greater precision, which is counterintuitive.
Confidence Level: The probability that the confidence interval will contain the true parameter
Precision: How narrow or wide the confidence interval is
Trade-off: The balance between confidence and precision
• Higher confidence level = larger MOE
• Lower confidence level = smaller MOE
• There's always a trade-off between confidence and precision
• Think of confidence as certainty and precision as sharpness
• You can't have maximum certainty and maximum precision simultaneously
• Common choices are 90%, 95%, and 99% depending on context
• Believing that higher confidence levels produce smaller margins of error
• Confusing confidence level with precision
• Not understanding the trade-off between confidence and precision
FAQ
Q: How does population size affect the margin of error?
A: For large populations, the population size has minimal effect on the margin of error. The basic margin of error formula assumes an infinite population or a population much larger than the sample. However, when the sample size is a significant proportion of the population (typically when n/N > 0.05), we use the finite population correction factor:
\( MOE_{finite} = MOE \times \sqrt{\frac{N-n}{N-1}} \)
Where N is the population size and n is the sample size. This correction factor is always less than 1, meaning the corrected MOE is smaller than the standard MOE. For most practical applications with large populations, the correction is negligible.
Q: What's the difference between margin of error and standard error?
A: The standard error measures the variability of a sample statistic across different samples:
\( SE = \frac{\sigma}{\sqrt{n}} \)
The margin of error incorporates the standard error along with the desired confidence level:
\( MOE = Z \times SE = Z \times \frac{\sigma}{\sqrt{n}} \)
Key differences:
- Standard error is a component of margin of error
- Standard error doesn't include confidence level consideration
- Margin of error gives the actual range of uncertainty
- Standard error is in the same units as the parameter being estimated
- Margin of error also depends on the critical value (Z-score)