P-Value Estimator
Statistics & probability • 2026 edition
P-Value Formula:
Show the calculator\( p = P(T \geq |t|) \)
Where:
- \( p \) = P-value
- \( T \) = Test statistic under null hypothesis
- \( t \) = Observed test statistic
The p-value is the probability of obtaining test results at least as extreme as the results actually observed, assuming the null hypothesis is correct. It quantifies the strength of evidence against the null hypothesis. A smaller p-value indicates stronger evidence against the null hypothesis.
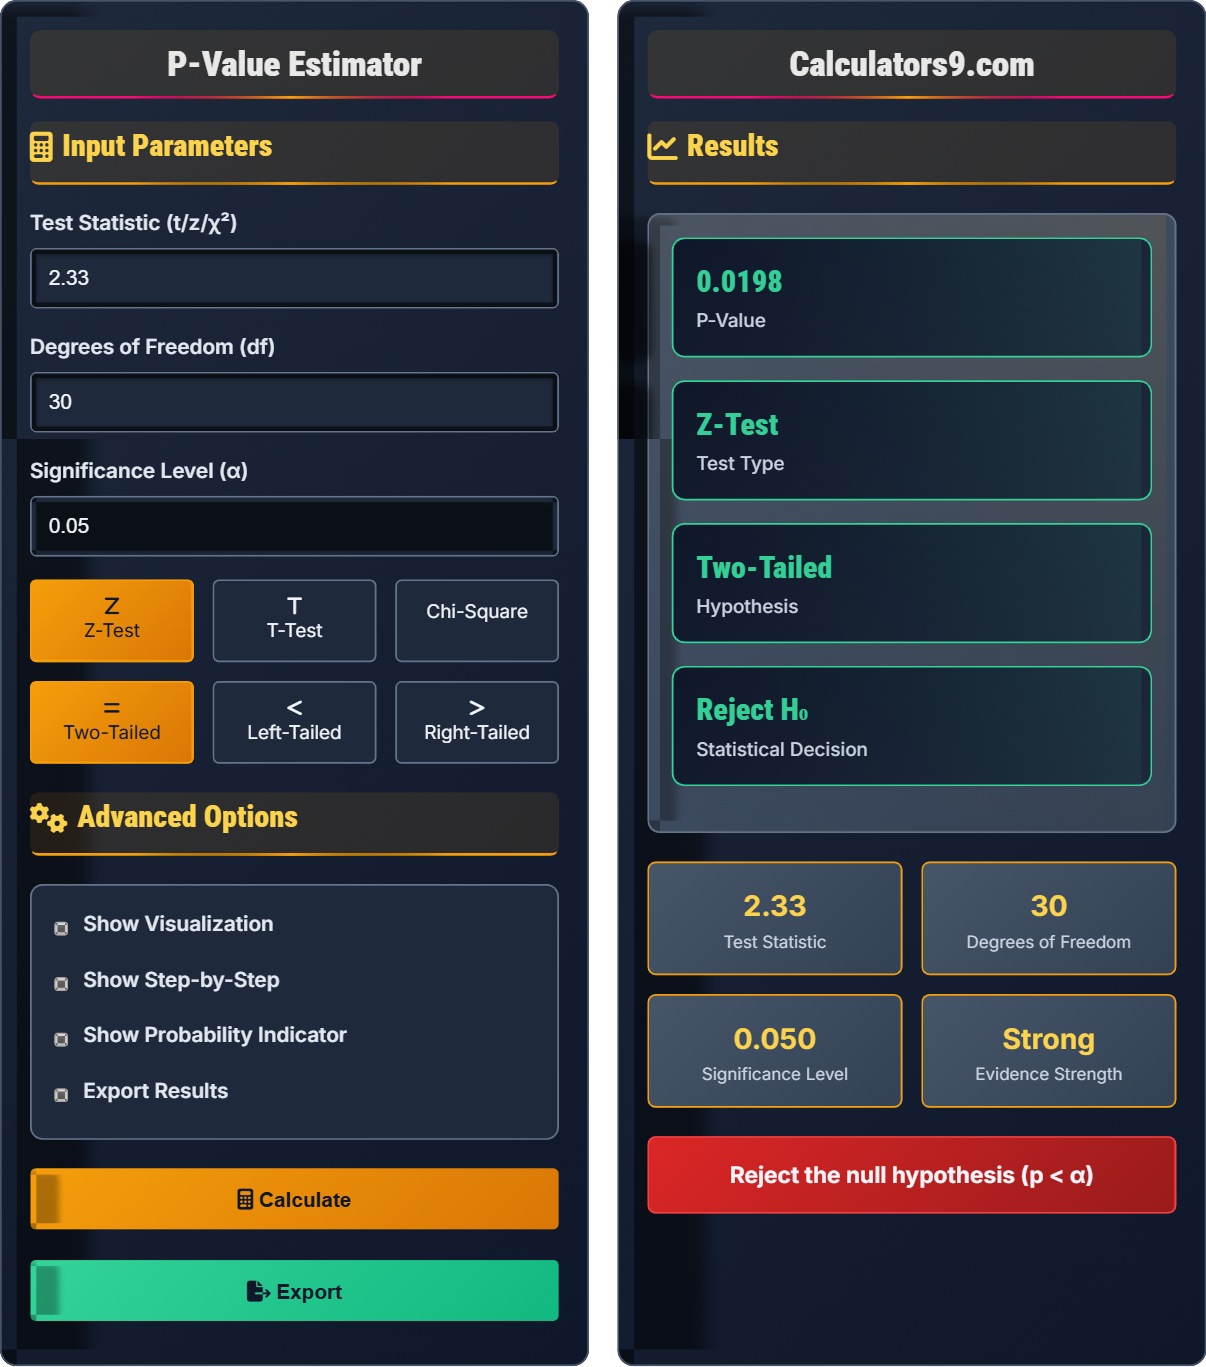
Example: For a two-tailed z-test with test statistic \( z = 2.33 \):
P(Z ≥ 2.33) = 0.0099
Two-tailed p-value = 2 × 0.0099 = 0.0198
Since p = 0.0198 < α = 0.05, we reject the null hypothesis.
Input Parameters
Z-Test
T-Test
Chi-Square
Advanced Options
Results
Comprehensive Statistics Guide
The p-value is the probability of obtaining test results at least as extreme as the results actually observed, assuming the null hypothesis is correct. It quantifies the strength of evidence against the null hypothesis. A smaller p-value indicates stronger evidence against the null hypothesis. Conventionally, if p ≤ 0.05, we reject the null hypothesis, suggesting the observed result is statistically significant.
The p-value measures the compatibility of the observed data with the null hypothesis:
- p ≤ 0.01: Very strong evidence against H₀
- 0.01 < p ≤ 0.05: Strong evidence against H₀
- 0.05 < p ≤ 0.10: Weak evidence against H₀
- p > 0.10: Little or no evidence against H₀
Types of alternative hypotheses:
- Two-Tailed: H₁: μ ≠ μ₀ (tests both directions, p-value is doubled)
- Left-Tailed: H₁: μ < μ₀ (tests left direction only)
- Right-Tailed: H₁: μ > μ₀ (tests right direction only)
- P-value ≠ Probability of H₀ being true
- P-value ≠ Effect size or practical significance
- Small p-value doesn't prove H₁ is true
- P-value depends on sample size
Statistics Fundamentals
The probability of observing data as extreme as or more extreme than the actual data, assuming H₀ is true.
p ≤ α: Reject H₀ | p > α: Fail to reject H₀
Where α is the significance level (typically 0.05).
- Smaller p = stronger evidence against H₀
- p-value doesn't measure effect size
- Context matters for interpretation
Applications
Used in research, quality control, medicine, psychology, and scientific experiments.
- Set significance level (α)
- Calculate test statistic
- Determine p-value
- Compare p-value to α
- Make statistical decision
- Assumptions about data distribution
- Sample representativeness
- Independence of observations
- Type I and Type II errors
Statistics Learning Quiz
Which of the following statements about p-values is CORRECT?
The answer is B) The p-value is the probability of observing data as extreme as observed, assuming H₀ is true. This is the correct definition of a p-value. It measures the probability of obtaining results at least as extreme as those observed, given that the null hypothesis is correct. It does NOT measure the probability that the null hypothesis is true.
This is a crucial distinction in statistical inference. The p-value assumes the null hypothesis is true and asks: "If H₀ were true, how surprising would our observed data be?" It doesn't tell us the probability that H₀ is true given the data. This misunderstanding is one of the most common misconceptions about p-values. The p-value is a measure of evidence against H₀, not a probability statement about H₀ itself.
P-Value: Probability of observing data as extreme as or more extreme than the actual data, assuming H₀ is true
Null Hypothesis (H₀): Default assumption that there is no effect or no difference
Alternative Hypothesis (H₁): Claim that contradicts the null hypothesis
• P-value assumes H₀ is true
• P-value is NOT P(H₀ is true)
• P-value measures evidence against H₀
• Think: "How surprising is this result if H₀ were true?"
• Smaller p-values indicate stronger evidence against H₀
• Context and effect size matter beyond p-values
• Confusing p-value with probability of H₀ being true
• Equating statistical significance with practical importance
• Interpreting p-value as probability of H₁ being true
A researcher conducts a two-tailed z-test with a test statistic of z = 1.96. Calculate the p-value and determine if the result is statistically significant at α = 0.05. Show your work.
For a two-tailed z-test with z = 1.96:
Step 1: Find the area in one tail: P(Z ≥ 1.96) = 0.025
Step 2: For two-tailed test: p-value = 2 × 0.025 = 0.05
Step 3: Compare to α: Since p = 0.05 = α = 0.05, the result is marginally significant.
Therefore, the p-value is 0.05, and we would typically reject H₀ at the 0.05 level.
This problem demonstrates the calculation for a two-tailed test. The key insight is that for a two-tailed test, we need to consider both tails of the distribution. The z-score of 1.96 is particularly important because it corresponds to the critical value for α = 0.05 in a two-tailed test. This is why P(Z ≥ 1.96) = 0.025, and multiplying by 2 gives us the two-tailed p-value of 0.05.
Two-Tailed Test: Tests for effects in both directions (≠ alternative hypothesis)
Critical Value: The threshold value that defines rejection region
Statistical Significance: When p-value ≤ α, indicating sufficient evidence against H₀
• Two-tailed p-value = 2 × one-tail probability
• Compare p-value directly to α level
• Critical value for α = 0.05 (two-tailed) is z = ±1.96
• Remember: Two-tailed = multiply by 2
• Critical values: 1.96 (α=0.05), 2.576 (α=0.01)
• Always state your conclusion in context
• Forgetting to multiply by 2 for two-tailed tests
• Using one-tailed critical values for two-tailed tests
• Not stating the direction of the test clearly
A pharmaceutical company claims their new drug reduces blood pressure by at least 10 mmHg compared to placebo. In a clinical trial with 100 participants, the mean reduction was 12 mmHg with a standard deviation of 8 mmHg. Calculate the test statistic and p-value for a one-tailed test (right-tailed). Is the result statistically significant at α = 0.01?
Setting up the hypotheses:
H₀: μ ≤ 10 (drug reduces BP by 10 mmHg or less)
H₁: μ > 10 (drug reduces BP by more than 10 mmHg)
Given: x̄ = 12, μ₀ = 10, s = 8, n = 100
Step 1: Calculate test statistic: t = (x̄ - μ₀)/(s/√n) = (12-10)/(8/√100) = 2/(8/10) = 2/0.8 = 2.5
Step 2: Degrees of freedom = n-1 = 99 ≈ 100
Step 3: For right-tailed test with df=100 and t=2.5: P(T₁₀₀ ≥ 2.5) ≈ 0.006
Step 4: Compare to α: 0.006 < 0.01, so we reject H₀.
Conclusion: At α = 0.01, there is sufficient evidence to support the claim that the drug reduces blood pressure by more than 10 mmHg.
This problem demonstrates a practical application of hypothesis testing in clinical trials. The one-tailed test is appropriate here because the company is specifically interested in whether the reduction exceeds 10 mmHg (not just different from 10). The large sample size allows us to use the t-distribution (though it approximates the z-distribution for large samples). The result is statistically significant at α = 0.01, providing strong evidence for the company's claim.
One-Tailed Test: Tests for effect in one specific direction (> or < alternative hypothesis)
Test Statistic: Calculated value used to determine whether to reject H₀
Statistical Power: Probability of correctly rejecting a false null hypothesis
• Choose test type (one-tailed vs two-tailed) before collecting data
• Use t-test when population std dev is unknown
• Large samples (n≥30) can use z-approximation
• Formulate hypotheses before looking at data
• Consider practical vs statistical significance
• Report both p-value and effect size
• Choosing test type after seeing data
• Forgetting to check assumptions
• Not considering practical significance
A manufacturing company produces bolts with a target diameter of 10mm. They want to test if the production process is producing bolts that are significantly different from the target. A sample of 25 bolts has a mean diameter of 10.2mm with a standard deviation of 0.5mm. Perform a hypothesis test at α = 0.05 and interpret the results. Should the production process be adjusted?
Setting up the hypotheses:
H₀: μ = 10 (process is on target)
H₁: μ ≠ 10 (process is off target)
Given: x̄ = 10.2, μ₀ = 10, s = 0.5, n = 25
Step 1: Calculate test statistic: t = (x̄ - μ₀)/(s/√n) = (10.2-10)/(0.5/√25) = 0.2/(0.5/5) = 0.2/0.1 = 2.0
Step 2: Degrees of freedom = n-1 = 24
Step 3: For two-tailed test with df=24 and t=2.0: P(|T₂₄| ≥ 2.0) ≈ 0.056
Step 4: Compare to α: 0.056 > 0.05, so we fail to reject H₀.
Conclusion: At α = 0.05, there is insufficient evidence to conclude that the process is producing bolts significantly different from the target. The production process may not need adjustment.
This demonstrates quality control testing using a two-tailed test since we're interested in deviations in either direction from the target. The result is close to the significance threshold, showing how important it is to consider both statistical significance and practical significance. Even though the mean is numerically different (10.2 vs 10), the difference isn't statistically significant at the chosen α level. This illustrates why we don't just look at raw differences but perform formal tests.
Type I Error: Rejecting H₀ when it's actually true (false positive)
Type II Error: Failing to reject H₀ when it's actually false (false negative)
Quality Control: Statistical methods to monitor and maintain product quality
• Two-tailed test when interested in any deviation from target
• Use t-distribution when σ is unknown and n < 30
• Statistical significance ≠ practical significance
• Consider the cost of Type I vs Type II errors
• Use two-tailed tests unless there's strong justification for one-tailed
• Always consider practical implications of results
• Using one-tailed test when two-tailed is appropriate
• Ignoring the difference between statistical and practical significance
• Making decisions based solely on p-values without context
Which of the following statements about significance levels and p-values is TRUE?
The answer is B) A higher α makes it easier to reject H₀. The significance level (α) is the threshold for deciding whether to reject the null hypothesis. A higher α means we're willing to accept a greater risk of Type I error (rejecting a true null hypothesis), which makes it easier to reject H₀. The p-value is calculated independently of α and represents the actual probability of observing the data assuming H₀ is true.
This highlights the relationship between α and the decision-making process. α is set before conducting the test and represents our tolerance for Type I error. The p-value is calculated from the data and represents the strength of evidence against H₀. We reject H₀ when p ≤ α. So if we increase α (say from 0.01 to 0.05), we're expanding our rejection region, making it easier to reject H₀. This also increases the risk of Type I error, which is why α is typically kept low.
Significance Level (α): Maximum acceptable probability of Type I error
Type I Error: Rejecting H₀ when it's actually true
Type II Error: Failing to reject H₀ when it's actually false
• α is set before conducting the test
• p-value is calculated from the data
• Reject H₀ if p ≤ α
• Think of α as your "tolerance" for false positives
• Lower α = more stringent test
• Common α values: 0.01, 0.05, 0.10
• Confusing α with p-value
• Thinking that changing α changes the p-value
• Not understanding the decision rule (p ≤ α)
FAQ
Q: What's the difference between p-value and significance level (α)?
A: The significance level (α) is the threshold you set before conducting the test to determine when to reject the null hypothesis. It represents your tolerance for Type I error:
\( \alpha = P(\text{Reject } H_0 | H_0 \text{ is true}) \)
The p-value is calculated from your data and represents the probability of observing results as extreme as yours, assuming the null hypothesis is true:
\( p = P(\text{Test statistic as extreme as observed} | H_0 \text{ is true}) \)
Decision rule: If p ≤ α, reject H₀. If p > α, fail to reject H₀. The p-value quantifies the strength of evidence against H₀, while α sets the criterion for statistical significance.
Q: Why do we sometimes use t-tests instead of z-tests?
A: The choice between t-tests and z-tests depends on whether the population standard deviation (σ) is known:
Z-test: Used when σ is known OR when sample size is large (n ≥ 30) and σ is unknown (central limit theorem applies)
T-test: Used when σ is unknown AND sample size is small (n < 30)
The t-distribution has heavier tails than the standard normal distribution, which accounts for the additional uncertainty introduced by estimating σ with the sample standard deviation (s). As sample size increases, the t-distribution approaches the standard normal distribution.
Mathematically:
Z-statistic: \( Z = \frac{\bar{x} - \mu_0}{\sigma/\sqrt{n}} \)
T-statistic: \( T = \frac{\bar{x} - \mu_0}{s/\sqrt{n}} \)