Z-Score Calculator
Statistics normal distribution calculator • Z test calculator
Z-Score Formula:
Show the calculator\( z = \frac{x - \mu}{\sigma} \)
Where:
- \( z \) = z-score (standard score)
- \( x \) = raw score
- \( \mu \) = population mean
- \( \sigma \) = population standard deviation
The z-score measures how many standard deviations a data point is from the mean. Positive z-scores indicate values above the mean, while negative z-scores indicate values below the mean. This standardization allows comparison across different distributions.
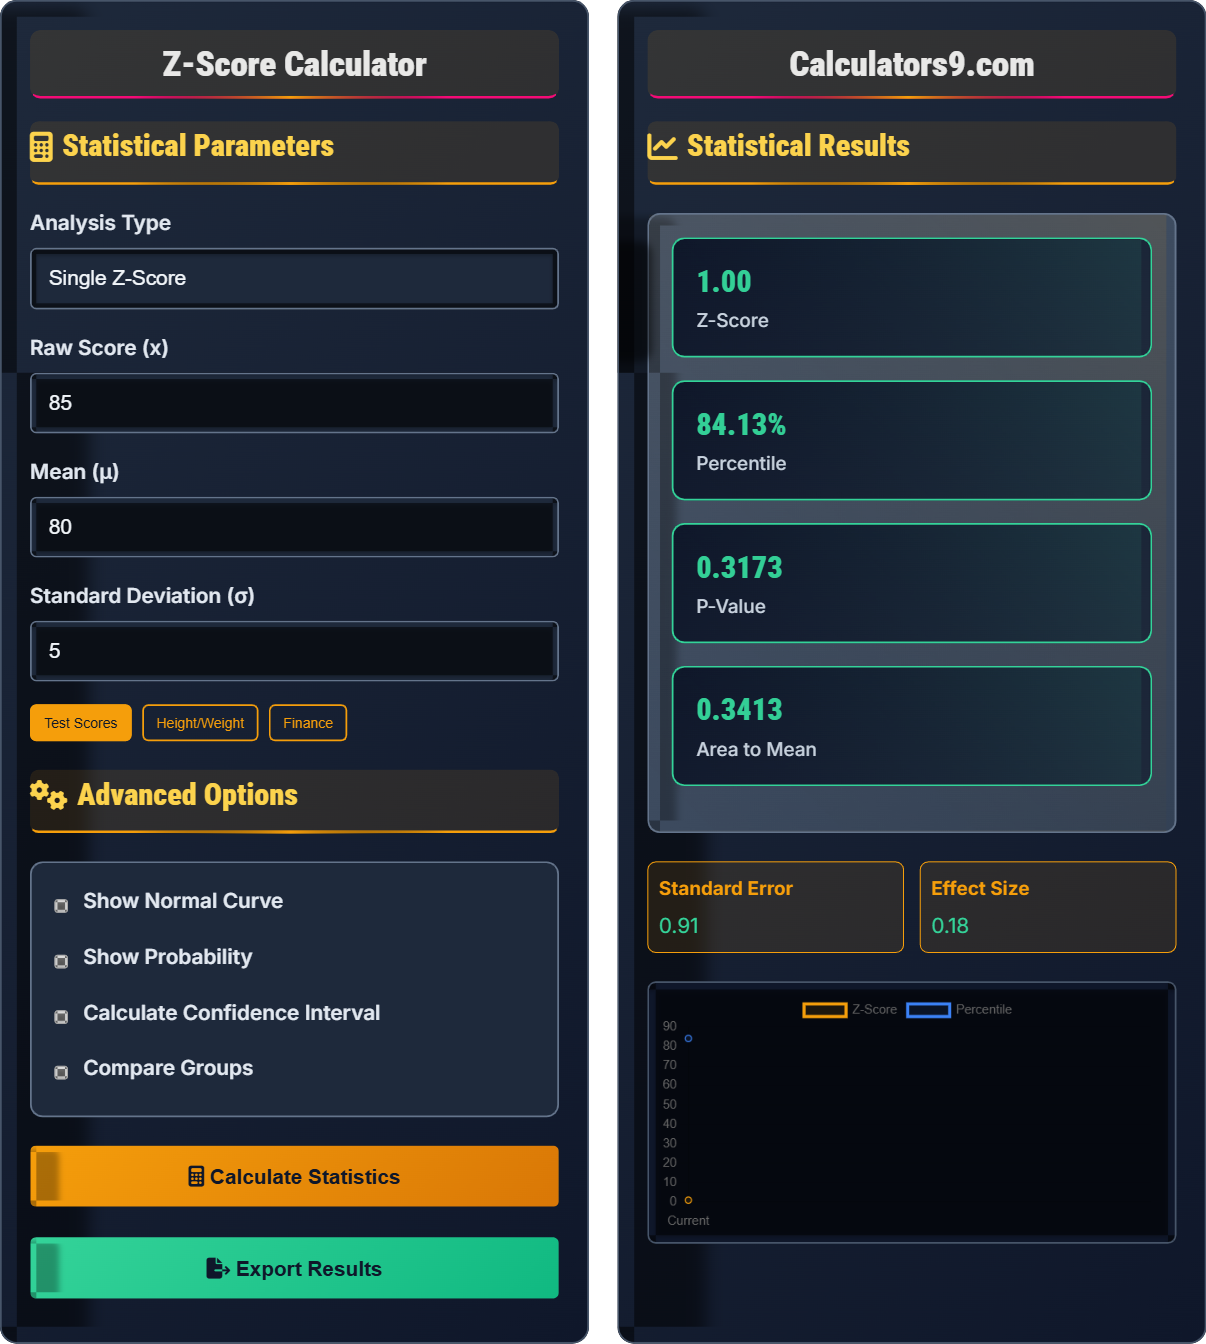
Example: For a score \( x = 85 \), mean \( \mu = 80 \), and standard deviation \( \sigma = 5 \):
\( z = \frac{85 - 80}{5} = 1.0 \)
Thus, the score is 1.0 standard deviation above the mean.
Statistical Parameters
Advanced Options
Statistical Results
Statistics Fundamentals
A z-score (also called a standard score) indicates how many standard deviations an element is from the mean. It standardizes scores from different normal distributions, allowing for comparison. Z-scores have a mean of 0 and standard deviation of 1, making them dimensionless and comparable across different scales.
The z-score is calculated using:
Where:
- \(z\) = z-score
- \(x\) = raw score
- \(\mu\) = population mean
- \(\sigma\) = population standard deviation
Key properties of the normal distribution:
- Empirical Rule: 68-95-99.7% within 1, 2, and 3 SDs
- Symmetry: Bell-shaped curve symmetric around the mean
- Central Limit Theorem: Sample means approach normality
- Standard Normal: Z-scores follow N(0,1) distribution
- Quality Control: Detecting outliers in manufacturing
- Psychometrics: Standardizing test scores
- Medicine: Interpreting lab results
- Finance: Risk assessment and portfolio analysis
- Research: Hypothesis testing and significance
Z-Score Concepts
Number of standard deviations from the mean.
\(z = \frac{x - \mu}{\sigma}\)
Where z=z-score, x=raw score, μ=mean, σ=std dev.
- Z-score of 0 = mean value
- Positive z = above mean
- Negative z = below mean
Statistical Relationships
Percentile = P(Z ≤ z)
- Standard Error: \(SE = \sigma/\sqrt{n}\)
- Confidence Interval: \(CI = \bar{x} ± z_{\alpha/2} \cdot SE\)
- Effect Size: \(d = (M_1 - M_2)/SD_{pooled}\)
- Assumes normal distribution
- Population parameters needed
- Sample size affects reliability
Standard Normal Table
This table shows the cumulative probability P(Z ≤ z) for standard normal distribution:
| Z | P(Z ≤ z) | Z | P(Z ≤ z) |
|---|---|---|---|
| -2.0 | 0.0228 | 0.0 | 0.5000 |
| -1.0 | 0.1587 | 0.5 | 0.6915 |
| -0.5 | 0.3085 | 1.0 | 0.8413 |
| 0.0 | 0.5000 | 1.5 | 0.9332 |
| 0.5 | 0.6915 | 2.0 | 0.9772 |
Statistics Learning Quiz
If the mean of a dataset is 75 and the standard deviation is 10, what is the z-score for a value of 85?
Using the z-score formula: \(z = \frac{x - \mu}{\sigma}\)
Given:
- Raw score (x) = 85
- Mean (μ) = 75
- Standard deviation (σ) = 10
Calculation: z = (85 - 75) / 10 = 10 / 10 = 1.0
The answer is B) 1.0
This is a direct application of the z-score formula. The z-score tells us how many standard deviations above or below the mean a particular value lies. In this case, the value 85 is exactly 1 standard deviation above the mean of 75. This standardization allows us to compare scores from different distributions.
Z-Score: Number of standard deviations from the mean
Standard Deviation: Measure of data spread around the mean
Standardization: Converting to z-scores to make comparisons possible
• z = (raw score - mean) / standard deviation
• Positive z-scores indicate values above the mean
• Negative z-scores indicate values below the mean
• Remember: z = (x - μ) / σ
• If z = 0, the score equals the mean
• |z| > 2 is considered unusual
• Forgetting to subtract the mean from the raw score
• Dividing by variance instead of standard deviation
• Getting the sign wrong (positive/negative)
A student scored 88 on a test where the mean was 72 and the standard deviation was 8. Calculate the z-score and interpret its meaning. What percentile does this score correspond to?
Step 1: Calculate the z-score
z = (x - μ) / σ = (88 - 72) / 8 = 16 / 8 = 2.0
Step 2: Interpretation
The z-score of 2.0 means the student's score is 2 standard deviations above the mean. This is considered quite good performance, as it falls in the upper portion of the distribution.
Step 3: Find the percentile
Looking up z = 2.0 in the standard normal table gives P(Z ≤ 2.0) = 0.9772 or 97.72%
The student scored better than approximately 97.7% of the test-takers.
This problem demonstrates both the calculation and interpretation of z-scores. A z-score of 2.0 is significantly above average (in the top 2.3% of scores). The percentile interpretation connects the z-score to the actual proportion of the population that scored below this value. This connection between z-scores and percentiles is fundamental in statistics.
Percentile: Percentage of scores that fall below a given value
Standard Normal Distribution: Normal distribution with mean=0 and std dev=1Unusual Value: Typically defined as |z| > 2 (more than 2 SD from mean)
• Z-scores allow comparison across different distributions
• Percentile = P(Z ≤ z) from standard normal table
• |z| > 2 indicates unusual values
• Memorize key z-scores: 1.0 = 84th percentile, 1.645 = 95th percentile
• Use the empirical rule: 68-95-99.7% within 1-2-3 SDs
• Always interpret z-scores in context of the problem
• Confusing z-score with percentile
• Not looking up the correct value in the standard normal table
• Misinterpreting positive vs. negative z-scores
A factory produces widgets with a target diameter of 2.5 cm. The standard deviation of the production process is 0.05 cm. If a widget has a diameter of 2.42 cm, what is its z-score? Is this value within acceptable limits if acceptable values are within 2 standard deviations of the mean?
Step 1: Calculate the z-score
Given: x = 2.42 cm, μ = 2.5 cm, σ = 0.05 cm
z = (2.42 - 2.5) / 0.05 = -0.08 / 0.05 = -1.6
Step 2: Determine acceptability
Acceptable range: -2 < z < 2
Since -2 < -1.6 < 2, the widget is within acceptable limits.
The widget's diameter is 1.6 standard deviations below the target, but still within the acceptable range.
This problem demonstrates a practical application of z-scores in quality control. By standardizing measurements, manufacturers can determine if products meet specifications regardless of the specific measurement scale. The concept of "acceptable limits" as a number of standard deviations from the mean is common in industrial settings.
Quality Control: Process of ensuring products meet specifications
Acceptable Limits: Range within which measurements are considered satisfactory
Target Value: Desired value for a process parameter
• Quality control often uses ±2 or ±3 standard deviations
• Z-scores standardize different measurement scales
• Negative z-scores indicate values below target
• In quality control, |z| > 3 often indicates defects
• Track both positive and negative deviations
• Use z-scores to compare processes with different targets
• Misinterpreting the acceptable range criteria
• Not considering the direction of deviation from target
A researcher hypothesizes that the average IQ in a population is 100 with a standard deviation of 15. A sample of 25 individuals has a mean IQ of 106. Calculate the z-score for this sample mean. Is this result statistically significant at the α = 0.05 level for a two-tailed test? (For a two-tailed test at α = 0.05, critical z-values are ±1.96)
Step 1: Calculate the standard error of the mean
SE = σ / √n = 15 / √25 = 15 / 5 = 3
Step 2: Calculate the z-score for the sample mean
z = (x̄ - μ) / SE = (106 - 100) / 3 = 6 / 3 = 2.0
Step 3: Determine statistical significance
Critical values for α = 0.05 (two-tailed): ±1.96
Since |2.0| > 1.96, the result is statistically significant.
The sample mean is significantly different from the population mean at the 0.05 level.
This problem introduces the concept of hypothesis testing using z-scores. When testing sample means against population parameters, we use the standard error of the mean (SE = σ/√n) rather than the population standard deviation. The critical value (±1.96 for α = 0.05) defines the rejection region for the null hypothesis.
Standard Error: Standard deviation of the sampling distribution
Hypothesis Testing: Statistical method to evaluate claims about populations
Statistical Significance: Result unlikely due to chance alone
• Use standard error for sample means: SE = σ/√n
• Critical z-value for α = 0.05 (two-tailed) = ±1.96
• Reject H₀ if |z| > critical value
• Always use standard error for sample statistics
• Remember: larger samples have smaller standard errors
• Two-tailed tests split α between both tails
• Using population standard deviation instead of standard error
• Forgetting to divide by √n in standard error calculation
• Using one-tailed critical values for two-tailed tests
According to the empirical rule (68-95-99.7 rule), approximately what percentage of data in a normal distribution falls within 2 standard deviations of the mean?
The answer is C) 95%. The empirical rule states that in a normal distribution:
- About 68% of data falls within 1 standard deviation of the mean
- About 95% of data falls within 2 standard deviations of the mean
- About 99.7% of data falls within 3 standard deviations of the mean
The empirical rule (also known as the 68-95-99.7 rule) provides quick approximations for normal distributions. These percentages correspond to z-scores of ±1, ±2, and ±3 respectively. Understanding this rule helps in quickly assessing the likelihood of observing certain values and interpreting z-scores in context.
Empirical Rule: Approximate percentages of data within SDs of mean in normal distribution
Normal Distribution: Symmetrical bell-shaped distribution
Standard Deviations: Units of measurement for z-scores
• 68% within 1 SD: -1 < z < 1
• 95% within 2 SDs: -2 < z < 2
• 99.7% within 3 SDs: -3 < z < 3
• Remember: 68-95-99.7 for 1-2-3 standard deviations
• Use this rule for quick probability estimates
• Helps identify outliers (values beyond 3 SDs)
• Confusing the percentages with different standard deviations
• Applying the rule to non-normal distributions
• Forgetting that the rule is approximate
FAQ
Q: What's the difference between z-scores and t-scores?
A: Both z-scores and t-scores standardize data, but they're used in different situations:
Z-scores are used when:
- Population standard deviation (σ) is known
- Sample size is large (n ≥ 30)
- Population is normally distributed
T-scores are used when:
- Population standard deviation is unknown
- Sample size is small (n < 30)
- Using sample standard deviation (s)
The t-distribution has heavier tails than the normal distribution, accounting for additional uncertainty when estimating the population standard deviation.
Q: How do I interpret a negative z-score?
A: A negative z-score indicates that the raw score is below the mean of the distribution. The magnitude of the negative z-score tells you how many standard deviations below the mean the score is located.
For example:
- A z-score of -1.0 means the score is 1 standard deviation below the mean
- A z-score of -2.0 means the score is 2 standard deviations below the mean
- A z-score of -0.5 means the score is 0.5 standard deviations below the mean
For a standard normal distribution (mean = 0, SD = 1):
- Negative z-scores correspond to percentiles less than 50%
- A z-score of -1.0 corresponds to approximately the 16th percentile
- A z-score of -1.645 corresponds to the 5th percentile
The interpretation is the same as positive z-scores, just in the opposite direction relative to the mean.