Campaign Reach Calculator
Optimize nonprofit marketing impact • 2026 metrics
Campaign Reach Formula:
\( CR = \sum_{i=1}^{n} (Audience_i \times Engagement\_Rate_i \times Frequency\_Cap_i) \)
Where:
- \( CR \) = Campaign Reach
- \( Audience_i \) = Audience size for channel \( i \)
- \( Engagement\_Rate_i \) = Engagement rate for channel \( i \)
- \( Frequency\_Cap_i \) = Maximum exposures per person
For a single channel:
\( CR = Audience \times ER \times FC \)
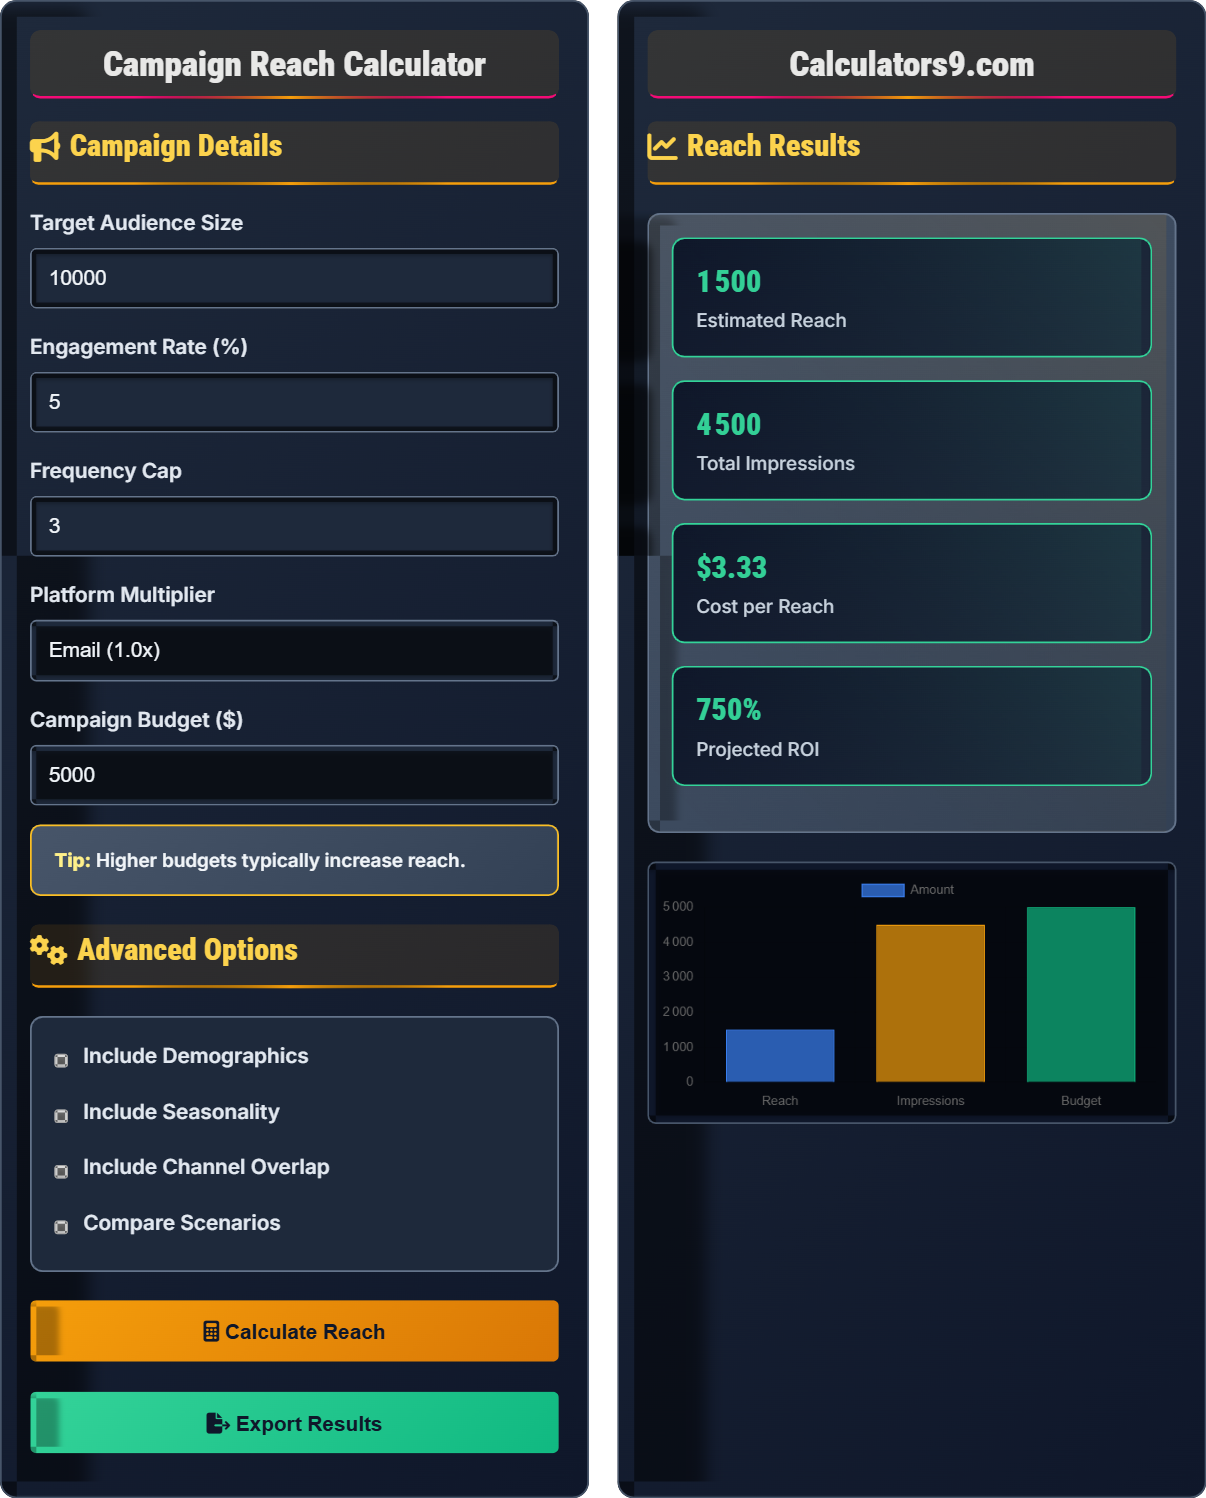
Example: If a campaign reaches 10,000 people with 5% engagement and 3 frequency cap:
\( CR = 10{,}000 \times 0.05 \times 3 = 1{,}500 \)
Thus, the campaign reaches 1,500 unique individuals.
Campaign Details
Advanced Options
Reach Results
| Metrics | Value |
|---|---|
| Target Audience | 10,000 |
| Engagement Rate | 5% |
| Frequency Cap | 3 |
| Estimated Reach | 1,500 |
| Channel | Reach | Percentage |
|---|
Campaign Reach Guide
Campaign reach refers to the total number of unique individuals who see or engage with your marketing content during a specific period. It's a critical metric for nonprofit organizations to understand how many potential donors, volunteers, or supporters they're connecting with through their campaigns.
The standard campaign reach calculation uses the following formula:
Where:
- \(CR\) = Campaign Reach
- \(Audience\) = Total number of people in target audience
- \(Engagement\ Rate\) = Percentage of audience that interacts with content
- \(Frequency\ Cap\) = Maximum number of times each person sees the content
Essential metrics to track for effective campaign planning:
- Unique Reach: Number of distinct individuals reached
- Impressions: Total number of times content is viewed
- Engagement Rate: Percentage of audience that interacts
- Cost per Reach: Amount spent to reach each person
- Return on Investment: Revenue generated per dollar spent
- Segment Audiences: Target specific donor segments for higher engagement
- Optimize Timing: Schedule campaigns during peak engagement periods
- Test Creative: Experiment with different content types and messaging
- Monitor Performance: Track metrics and adjust strategies accordingly
- Integrate Channels: Combine multiple platforms for maximum coverage
Campaign Reach Learning Quiz
If a campaign targets 50,000 people with a 3% engagement rate and a frequency cap of 4, what is the estimated reach?
Reach = Audience × Engagement Rate × Frequency Cap
Reach = 50,000 × 0.03 × 4 = 6,000
The answer is B) 6,000.
This calculation shows how the frequency cap affects the total reach. Even though the campaign reaches 50,000 people, only 3% of them engage. However, each person who engages may see the content up to 4 times, which increases the overall reach calculation. This demonstrates the importance of considering both engagement and frequency when planning campaigns.
Reach: Number of unique individuals exposed to content
Engagement Rate: Percentage of audience that interacts with content
Frequency Cap: Maximum number of times content is shown to one person
• Reach = Audience × Engagement Rate × Frequency
• Higher engagement rates increase reach
• Frequency caps limit redundant exposure
• Remember: Unique individuals matter more than impressions
• Optimize for engagement rate rather than just reach
• Consider platform-specific engagement rates
• Confusing reach with impressions
• Not accounting for frequency caps
• Assuming all audience members engage equally
If a campaign costs $10,000 and reaches 4,000 people, what is the cost per reach? How does this compare to the industry benchmark of $2.50 per reach?
Cost per Reach = Total Campaign Cost ÷ Number of People Reached
Cost per Reach = $10,000 ÷ 4,000 = $2.50 per person
This matches the industry benchmark exactly, indicating an efficient campaign.
Cost per reach is a critical metric for nonprofit organizations as it helps determine the efficiency of their marketing spend. A cost of $2.50 per person reached is considered standard for the nonprofit sector. Lower costs indicate more efficient campaigns, while higher costs suggest the need for optimization.
Cost per Reach: Amount spent to reach each unique individual
Efficiency Metric: Measures cost-effectiveness of campaigns
Industry Benchmark: Standard for comparison across organizations
• Cost per Reach = Total Cost ÷ Unique Reach
• Lower costs indicate better efficiency
• Compare to industry benchmarks for context
• Aim for costs below industry average
• Track costs by platform for optimization
• Consider lifetime value when evaluating costs
• Confusing cost per reach with cost per impression
• Not tracking costs by platform
• Focusing only on reach without considering quality
A nonprofit runs a campaign across two channels: Email reaches 10,000 people with 15% engagement and frequency of 2, while social media reaches 25,000 people with 3% engagement and frequency of 4. If there's a 10% overlap between channels, what is the total unique reach?
Email Reach: 10,000 × 0.15 × 2 = 3,000
Social Media Reach: 25,000 × 0.03 × 4 = 3,000
Total Before Overlap: 3,000 + 3,000 = 6,000
Overlap: 6,000 × 0.10 = 600
Total Unique Reach: 6,000 - 600 = 5,400
The campaign reaches 5,400 unique individuals.
This example demonstrates the importance of accounting for audience overlap when running multi-channel campaigns. While the combined reach appears to be 6,000 people, 10% of those individuals are counted in both channels. Subtracting the overlap gives the true unique reach, which is essential for accurate campaign evaluation.
Multi-Channel: Using multiple platforms simultaneously
Audience Overlap: People reached through multiple channels
Unique Reach: Distinct individuals across all channels
• Calculate reach per channel separately
• Account for audience overlap
• Unique Reach = Total - Overlap
• Use audience insights to minimize overlap
• Track performance by channel
• Consider synergistic effects of multi-channel
• Not accounting for audience overlap
• Adding reaches from different channels without adjustment
• Assuming all channels reach entirely different audiences
A nonprofit has a $15,000 budget for a campaign. Email marketing costs $0.50 per person reached with 20% engagement, while social media costs $1.50 per person reached with 5% engagement. If they want to maximize reach, how should they allocate their budget?
Email Cost per Reach: $0.50 (higher engagement = more efficient)
Social Media Cost per Reach: $1.50 (lower engagement = less efficient)
To maximize reach, allocate entire budget to email:
Reach with Email: $15,000 ÷ $0.50 = 30,000 people
Reach with Social Media: $15,000 ÷ $1.50 = 10,000 people
Therefore, spend entire budget on email for maximum reach of 30,000 people.
This demonstrates how cost per reach can guide budget allocation decisions. While social media might offer broader demographic reach, email marketing provides more efficient spending in terms of people reached per dollar. However, organizations should also consider audience diversity and long-term relationship building when making allocation decisions.
Budget Allocation: Distribution of funds across marketing channels
Cost Efficiency: Getting maximum results for minimum cost
ROI Optimization: Maximizing return on marketing investment
• Lower cost per reach = higher efficiency
• Consider both cost and audience quality
• Diversify for audience coverage
• Prioritize channels with lowest cost per reach
• Balance efficiency with audience diversity
• Test different allocations for optimization
• Allocating budget evenly without considering efficiency
• Focusing only on cost without considering audience quality
• Not testing different allocation strategies
Which factor has the greatest impact on campaign reach effectiveness?
The answer is C) Engagement rate. While all factors are important, engagement rate is the critical multiplier that determines how many people in the audience actually interact with the content. A large audience with low engagement will have less impact than a smaller audience with high engagement. Engagement rate directly affects how many people move from seeing the message to taking action.
Engagement rate is the most important factor because it represents the percentage of people who find the content compelling enough to act. A campaign reaching 1 million people with 0.1% engagement will have less impact than one reaching 100,000 people with 10% engagement. This is why nonprofits should focus on creating compelling, relevant content that resonates with their target audience.
Engagement Rate: Percentage of audience that interacts with content
Content Relevance: How well content matches audience interestsAction Conversion: Moving from engagement to actual donation/support
• Engagement rate amplifies all other metrics
• Quality content drives higher engagement
• Targeted audiences have higher engagement
• Focus on audience segmentation for relevance
• Create compelling, story-driven content
• Test different messaging approaches
• Prioritizing reach over engagement
• Not testing content effectiveness
• Using generic messaging for all audiences
Reach Metrics
Number of unique individuals exposed to campaign content.
\(Reach = Audience \times Engagement\ Rate \times Frequency\)
Where Reach=unique individuals, Audience=total size, Rate=interaction rate.
- Focus on quality over quantity
- Track engagement rates by platform
- Account for audience overlap
Best Practices
Optimize campaigns for maximum reach effectiveness.
- Segment audiences by demographics
- Test content with small groups
- Monitor metrics continuously
- Optimize based on performance
- Email Engagement: 15-25%
- Social Media: 1-5%
- Cost per Reach: $2-5
- Frequency Cap: 3-5
FAQ
Q: How do I determine the right engagement rate for my nonprofit's campaign?
A: Engagement rates vary significantly by platform and audience. For nonprofits, typical benchmarks are:
- Email: 15-25% (higher due to engaged donor base)
- Facebook: 2-5% (organic reach is limited)
- Instagram: 1-3% (visual content performs well)
- LinkedIn: 2-4% (professional audience)
Formula: \( Engagement\ Rate = \frac{Engaged\ Users}{Total\ Reach} \times 100 \)
For example, if your email campaign reaches 10,000 people and 2,000 open/read it: \( ER = \frac{2{,}000}{10{,}000} \times 100 = 20\% \).
Start with benchmarks, then track your own performance to establish realistic targets.
Q: What's the difference between reach and impressions in nonprofit marketing?
A: Reach and impressions are distinct metrics in nonprofit marketing:
- Reach: Number of unique individuals who saw your content at least once
- Impressions: Total number of times your content was displayed
Formula: \( Impressions = Reach \times Average\ Frequency \)
For example, if your campaign reaches 1,000 unique people and each person sees it an average of 3 times: \( Impressions = 1{,}000 \times 3 = 3{,}000 \).
For nonprofits, reach is more important than impressions because you want to connect with new supporters. However, multiple impressions can reinforce your message and encourage action.