Impact Metric Calculator
Measure nonprofit effectiveness • 2026 metrics
Impact Metric Formula:
\( IM = \frac{Social\ Value}{Total\ Investment} \)
Where:
- \( IM \) = Impact Metric
- \( Social\ Value \) = Quantified benefit to beneficiaries
- \( Total\ Investment \) = All resources invested
For Social Return on Investment (SROI):
\( SROI = \frac{Total\ Outcomes\ Value}{Total\ Input\ Value} \)
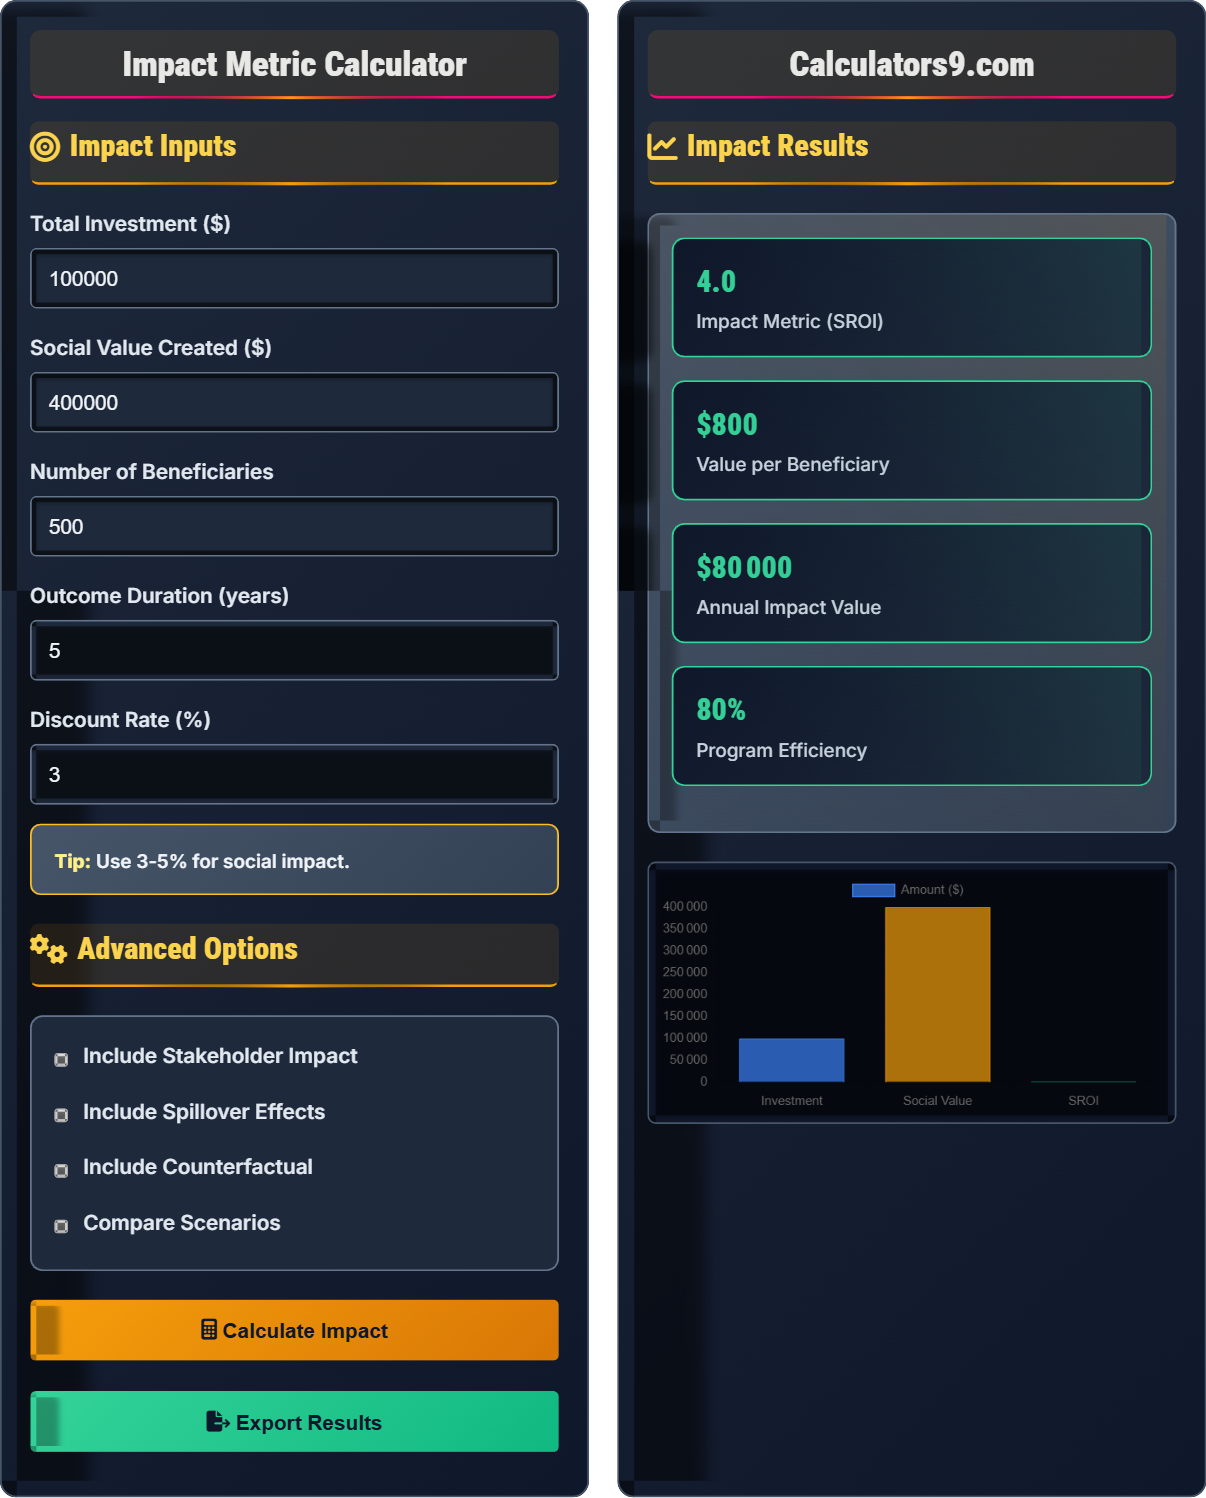
Example: If a program invests $100,000 and creates $400,000 in social value:
\( IM = \frac{\$400{,}000}{\$100{,}000} = 4.0 \)
Thus, every $1 invested generates $4 in social value.
Impact Inputs
Advanced Options
Impact Results
| Metrics | Value |
|---|---|
| Total Investment | $100,000 |
| Social Value | $400,000 |
| Beneficiaries | 500 |
| Impact Ratio | 4:1 |
| Component | Amount | Percentage |
|---|
Impact Measurement Guide
Impact measurement quantifies the social, environmental, and economic value created by nonprofit programs. It goes beyond outputs to measure actual outcomes and changes experienced by beneficiaries. Effective impact measurement helps organizations demonstrate accountability, attract funding, and improve program effectiveness.
The standard impact measurement calculation uses the following formula:
Where:
- \(IM\) = Impact Metric
- \(Social\ Value\) = Quantified benefit to beneficiaries
- \(Total\ Investment\) = All resources invested
Essential metrics to track for effective impact measurement:
- Outcome Indicators: Changes in beneficiary conditions
- Output Indicators: Direct products of program activities
- Efficiency Ratios: Cost per unit of outcome achieved
- Sustainability Measures: Long-term impact persistence
- Attribution Metrics: Degree of change attributable to program
- Set Baseline: Measure starting conditions before intervention
- Use Mixed Methods: Combine quantitative and qualitative data
- Involve Stakeholders: Include beneficiaries in design and evaluation
- Plan for Attribution: Establish causality between program and outcomes
- Report Transparently: Share both successes and challenges
Impact Measurement Learning Quiz
If a program invests $200,000 and generates $600,000 in social value, what is the SROI ratio?
SROI = Social Value ÷ Total Investment
SROI = $600,000 ÷ $200,000 = 3
The SROI ratio is 3:1, meaning every $1 invested generates $3 in social value.
The answer is B) 3:1.
This calculation shows the efficiency of social investments. An SROI of 3:1 indicates that the program is highly effective at creating value. This metric helps organizations demonstrate the return on investment to funders and stakeholders, making it easier to secure continued funding.
SROI (Social Return on Investment): Measure of social value created per dollar invested
Social Value: Quantified benefits to beneficiaries and society
Investment: All resources (financial, human, material) invested in program
• SROI = Social Value ÷ Total Investment
• Values must be quantified in monetary terms
• Include both direct and indirect benefits
• Express SROI as ratio (e.g., 3:1) or decimal (e.g., 3.0)
• Include spillover effects for comprehensive measurement
• Use appropriate discount rates for long-term impacts
• Including only direct costs and forgetting indirect costs
• Not accounting for time value of money
• Measuring outputs instead of outcomes
If a program generates $100,000 in outcomes, but $20,000 of those outcomes would have occurred anyway (counterfactual), what is the adjusted social value?
Adjusted Social Value = Total Outcomes - Counterfactual
Adjusted Social Value = $100,000 - $20,000 = $80,000
The adjusted social value is $80,000.
The counterfactual adjustment is crucial for accurate impact measurement. It accounts for the fact that some positive outcomes might occur without the program intervention. By subtracting the counterfactual, we isolate the actual impact attributable to the program, providing a more accurate measure of program effectiveness.
Counterfactual: Outcomes that would have occurred without program intervention
Attribution: Linking outcomes directly to program activities
Additionality: Value created specifically by the program
• Adjusted Value = Total Value - Counterfactual
• Always account for what would have happened anyway
• Use comparison groups to estimate counterfactual
• Use control groups to estimate counterfactual
• Consider historical trends and trends in similar populations
• Document assumptions clearly
• Not accounting for counterfactual at all
• Overestimating the program's contribution to outcomes
• Failing to document attribution assumptions
A job training program serves 200 people with total costs of $250,000. Of the participants, 150 get jobs earning $30,000 annually, 30 get jobs earning $40,000 annually, and 20 remain unemployed. Calculate the 3-year social value assuming 50% of earnings represent social value and ignoring counterfactual.
Yearly Earnings: (150 × $30,000) + (30 × $40,000) = $4,500,000 + $1,200,000 = $5,700,000
3-Year Earnings: $5,700,000 × 3 = $17,100,000
Social Value: $17,100,000 × 50% = $8,550,000
The 3-year social value is $8,550,000.
This example demonstrates how to calculate social value from employment outcomes. It accounts for different salary levels and extends the impact over multiple years. The 50% assumption represents the portion of earnings that reflects social value rather than private benefit. This approach helps quantify the broader economic impact of employment programs.
Employment Outcomes: Jobs obtained as result of program participation
Salary Multipliers: Factors to convert earnings to social value
Temporal Extension: Projecting impacts over multiple years
• Calculate impacts for each participant group separately
• Extend impacts over appropriate time horizon
• Apply appropriate social value multipliers
• Use actual employment data when available
• Consider indirect economic impacts (spending, tax revenue)
• Account for program completion rates
• Treating all participants equally regardless of outcomes
• Not extending impacts over appropriate timeframe
• Using inappropriate multipliers for social value
A health program costs $100,000 and directly benefits 100 people with a social value of $300,000. The program also benefits families of participants (2.5 family members per participant) with 40% of the individual benefit value. Calculate the total social value including family spillovers.
Direct Beneficiaries: 100 people
Family Members: 100 × 2.5 = 250 family members
Family Benefit: $300,000 × 40% = $120,000
Total Social Value: $300,000 + $120,000 = $420,000
Adjusted SROI: $420,000 ÷ $100,000 = 4.2
The total social value including spillovers is $420,000.
This example demonstrates how to account for spillover effects in impact measurement. Many nonprofit programs create benefits that extend beyond direct participants to their families and communities. Including these spillovers provides a more comprehensive view of the program's social value, though it requires careful estimation of the magnitude of these indirect effects.
Spillover Effects: Benefits that extend beyond direct participants
Indirect Impact: Value created for non-participants
Multiplier Effects: Economic impacts that ripple through economy
• Identify all affected stakeholder groups
• Estimate magnitude of spillover effects
• Avoid double-counting benefits
• Map all stakeholders affected by program
• Use research literature to estimate spillover magnitudes
• Document spillover assumptions clearly
• Overestimating spillover effects without evidence
• Not accounting for spillovers when they're significant
• Double-counting benefits across stakeholder groups
Which approach is most appropriate for measuring long-term outcomes in a complex community development program?
The answer is B) Social Return on Investment (SROI). SROI is particularly well-suited for complex, long-term community development programs because it can capture multiple outcomes across different stakeholder groups, account for time value of money, and express diverse impacts in a common metric (monetary value).
Community development programs often have complex, interconnected outcomes that unfold over time. SROI allows organizations to quantify diverse impacts (economic, social, environmental) in monetary terms, making it possible to calculate an overall return on investment. While RCTs are gold standard for attribution, they may not be feasible for complex programs with multiple outcomes.
Complex Programs: Interventions with multiple components and stakeholders
Long-term Outcomes: Impacts realized over extended timeframes
Monetization: Converting outcomes to monetary values
• Match evaluation method to program complexity
• Consider feasibility and resource constraints
• Ensure evaluation design supports intended use
• Use mixed-method approaches for complex programs
• Involve stakeholders in evaluation design
• Plan evaluation early in program lifecycle
• Using simple methods for complex programs
• Not planning for long-term data collection
• Failing to account for multiple stakeholder perspectives
Impact Metrics
Social Return on Investment measures social value per dollar invested.
\(SROI = \frac{Social\ Value}{Total\ Investment}\)
Where SROI=return ratio, Social Value=quantified benefits, Investment=resources.
- Quantify all benefits in monetary terms
- Account for counterfactual outcomes
- Include spillover effects
Best Practices
Systematic approach to impact assessment.
- Establish baseline measurements
- Use mixed methodologies
- Involve stakeholders in design
- Report transparently
- SROI: 3:1 or higher
- Attribution: 70-90%
- Efficiency: 75-85%
- Sustainability: 60-80%
FAQ
Q: How do we monetize social outcomes that don't have obvious financial value?
A: Monetizing non-financial outcomes requires several approaches:
- Willingness to Pay: Survey beneficiaries about how much they would pay for the benefit
- Cost Avoidance: Calculate costs avoided due to improved outcomes (e.g., reduced healthcare costs)
- Replacement Cost: Estimate cost of replacing the benefit with commercial alternatives
- Peer Comparison: Use values from similar programs in research literature
For example, to monetize reduced crime: \( Monetary\ Value = Crime\ Prevention\ Rate \times Average\ Cost\ per\ Crime \)
Using research data, if a program prevents 10 crimes and the average cost per crime is $25,000: \( MV = 10 \times \$25{,}000 = \$250{,}000 \).
Always document your valuation methods and assumptions clearly.
Q: What's the difference between outputs and outcomes in impact measurement?
A: Outputs and outcomes are distinct concepts in impact measurement:
- Outputs: Direct products of program activities (e.g., workshops delivered, meals served)
- Outcomes: Changes in beneficiaries' conditions as result of program (e.g., skills gained, health improved)
Formula: \( Outcomes = f(Outputs, Context, Individual\ Factors) \)
For example, if a literacy program serves 100 students (output), and 80 of them improve reading skills by 2 grade levels (outcome), the output is 100 served but the outcome is the 80 improvements.
Impact measurement focuses on outcomes rather than outputs because outcomes represent actual change in beneficiaries' lives.