Implied Volatility Calculator
Options trading • Derivatives analysis
Black-Scholes Formula:
Show the calculatorFor Call Option: \( C = S_0 N(d_1) - K e^{-rT} N(d_2) \)
For Put Option: \( P = K e^{-rT} N(-d_2) - S_0 N(-d_1) \)
Where:
- \( C \) = Call option price
- \( P \) = Put option price
- \( S_0 \) = Current stock price
- \( K \) = Strike price
- \( r \) = Risk-free interest rate
- \( T \) = Time to expiration (years)
- \( \sigma \) = Volatility
- \( N(x) \) = Cumulative distribution function of standard normal distribution
- \( d_1 = \frac{\ln(S_0/K) + (r + \sigma^2/2)T}{\sigma\sqrt{T}} \)
- \( d_2 = d_1 - \sigma\sqrt{T} \)
Implied volatility is the volatility value that makes the theoretical option price equal to the market price.
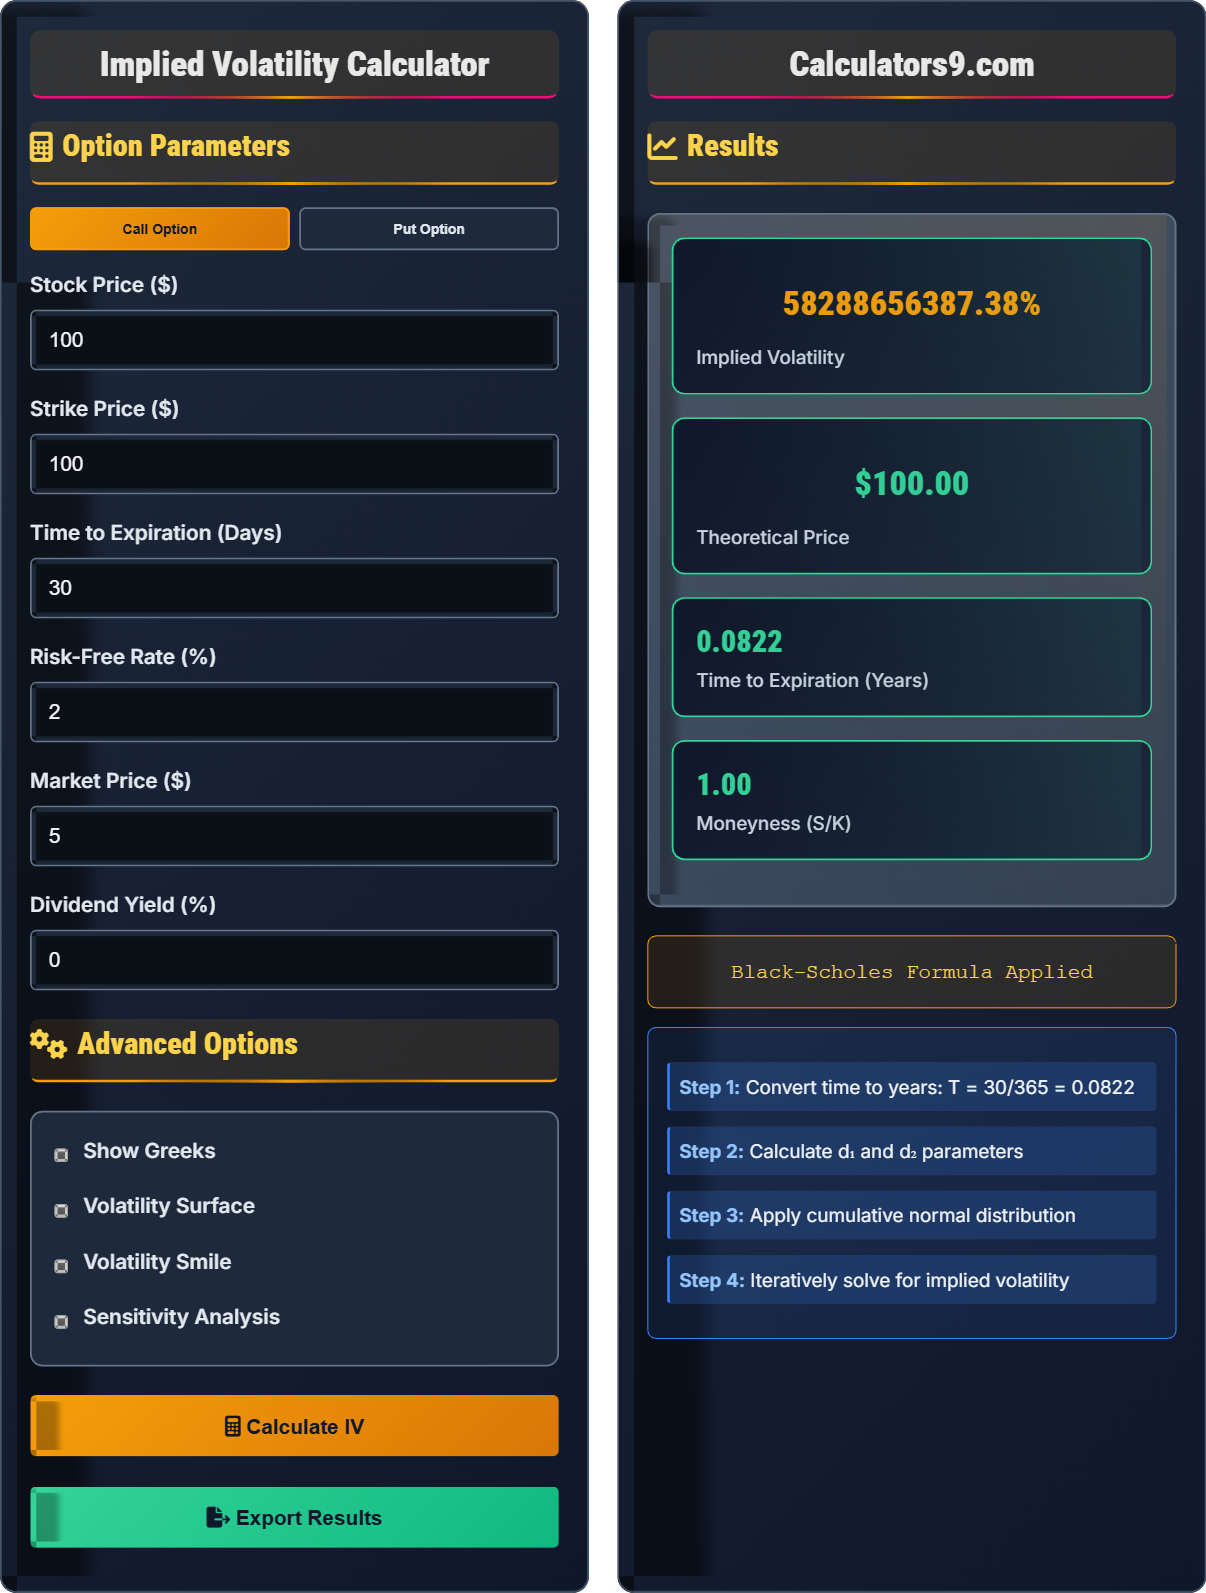
Example: For a call option with \( S_0 = \$100 \), \( K = \$100 \), \( r = 2\% \), \( T = 0.5 \) years, and market price of \$5:
Implied volatility ≈ 20% (solved iteratively)
Option Parameters
Advanced Options
Results
Options Trading & Implied Volatility Guide
Implied volatility (IV) is a metric that captures the market's expectation of future volatility of an underlying asset. It is derived from the prices of options contracts using mathematical models like Black-Scholes. Unlike historical volatility, which measures past price movements, implied volatility reflects market sentiment about future price fluctuations.
Higher implied volatility indicates that the market expects larger price swings, making options more expensive. Lower IV suggests smaller expected movements, resulting in cheaper options.
The Black-Scholes model is the foundational formula for options pricing. The key insight is that implied volatility is the volatility parameter that, when input into the Black-Scholes formula, produces the observed market price of an option.
Where:
- \(C\) = Call option price
- \(S_0\) = Current stock price
- \(K\) = Strike price
- \(r\) = Risk-free interest rate
- \(T\) = Time to expiration
- \(\sigma\) = Volatility (the unknown we're solving for)
Historical Volatility: Calculated from past price movements, usually annualized standard deviation of returns.
Implied Volatility: Derived from option prices, represents market's forward-looking expectation.
Volatility Smile: Pattern where out-of-the-money options have higher implied volatility than at-the-money options.
Volatility Surface: Three-dimensional representation showing implied volatility across different strikes and maturities.
- Buying Calls/Puts: When expecting significant price movement
- Selling Covered Calls: To generate income from owned stocks
- Iron Condor: Profit from low volatility environments
- Straddle/Strangle: Profit from high volatility expectations
- Vega Plays: Trade volatility rather than direction
Implied Volatility Basics
Forward-looking measure of expected price volatility derived from option prices.
\(C = S_0 N(d_1) - K e^{-rT} N(d_2)\)
Solve for σ that matches market price.
- IV increases with uncertainty
- High IV = expensive options
- Low IV = cheap options
- IV mean-reverts over time
Trading Applications
Pattern where OTM options have higher IV than ATM options.
- High IV tends to revert to average
- Low IV tends to revert upward
- Trade IV extremes
- Combine with directional bias
- IV rank matters for timing
- Greeks change with price/time
- Volatility clustering occurs
- Events drive IV spikes
Options & IV Learning Quiz
What does implied volatility represent in options trading?
The answer is B) Market's expectation of future volatility. Implied volatility is derived from the current market prices of options and reflects what the market expects the future volatility of the underlying asset to be. It is forward-looking, unlike historical volatility which looks backward at actual price movements.
Think of implied volatility as the market's "forecast" of future uncertainty. When traders expect big price moves (like before earnings announcements), option prices rise, pushing up implied volatility. The higher the implied volatility, the more expensive the options become, reflecting the market's anticipation of larger price swings.
Implied Volatility (IV): The volatility parameter that, when input into an option pricing model, produces the observed market price
Historical Volatility: Actual volatility measured from past price movements
Forward-Looking: Based on expectations rather than past performance
• IV is derived from option prices, not historical data
• Higher IV makes options more expensive
• IV reflects market sentiment about future uncertainty
• High IV means expensive options (good for sellers)
• Low IV means cheap options (good for buyers)
• IV tends to mean-revert over time
• Confusing IV with historical volatility
• Thinking IV predicts direction of price movement
• Ignoring IV when evaluating options trades
Calculate the approximate effect on a call option's price when implied volatility increases from 20% to 30%, given that the option has a vega of 0.15. Show your work.
Vega measures sensitivity to volatility changes.
Given:
- Initial IV = 20%
- New IV = 30%
- Vega = 0.15
Step 1: Calculate volatility change = 30% - 20% = 10 percentage points = 0.10
Step 2: Calculate price change = Vega × Volatility change
Step 3: Price change = 0.15 × 0.10 = 0.015
Therefore, the call option's price will increase by approximately $0.015 (or $1.50 per contract) when implied volatility increases by 10 percentage points.
This demonstrates the direct relationship between implied volatility and option prices. Vega tells us how much an option's price changes for each 1% change in implied volatility. For long option positions, rising IV is beneficial (positive vega), while for short option positions, falling IV is beneficial (negative vega).
Vega: Sensitivity of option price to changes in implied volatility
Percentage Points: Absolute difference in percentage (not percent change)
Positive/Negative Vega: Direction of sensitivity to IV changes
• Vega is always positive for long options
• Higher IV leads to higher option prices
• Vega is highest for at-the-money options
• Remember: Vega measures sensitivity to volatility changes
• At-the-money options have highest vega
• Longer-dated options have higher vega
• Confusing percentage points with percent change
• Thinking vega can be negative for long positions
• Ignoring that vega changes with other factors
An option trader notices that a particular stock's current implied volatility is 35%, while its 52-week range of implied volatility has been 20% to 40%. What is the IV rank, and what does this suggest about the current options pricing environment?
Step 1: Calculate IV rank using the formula:
IV Rank = (Current IV - Min IV) / (Max IV - Min IV) × 100
Step 2: IV Rank = (35 - 20) / (40 - 20) × 100
Step 3: IV Rank = 15 / 20 × 100 = 75%
Therefore, the IV rank is 75%, which means implied volatility is currently at the 75th percentile of its 52-week range. This suggests options are relatively expensive compared to recent history, making it potentially favorable to sell options rather than buy them.
IV rank is crucial for timing options trades. A 75% IV rank means options are trading in the upper quartile of their historical range. Traders often look for high IV rank to sell options (when they're expensive) and low IV rank to buy options (when they're cheap). This relative measure helps determine whether options are overpriced or underpriced.
IV Rank: Current IV relative to its historical range (0-100 scale)
High IV Rank: Options are expensive relative to history
Low IV Rank: Options are cheap relative to history
• IV Rank = (Current - Min) / (Max - Min) × 100
• High IV rank favors selling options
• Low IV rank favors buying options
• IV rank of 80+ suggests expensive options
• IV rank of 20- suggests cheap options
• Combine with directional outlook for best results
• Confusing IV rank with IV percentile
• Using too short a time frame for historical range
• Ignoring fundamental factors affecting IV
You own a call option with the following Greeks: Delta = 0.55, Gamma = 0.06, Theta = -0.03, Vega = 0.12. If the underlying stock price increases by $2 and implied volatility decreases by 5 percentage points over the next day, what is the approximate change in your option's value?
Step 1: Calculate delta impact = Delta × Stock price change = 0.55 × $2 = $1.10
Step 2: Calculate vega impact = Vega × Volatility change = 0.12 × (-0.05) = -$0.006
Step 3: Calculate theta impact = Theta × Time decay = -0.03 × 1 day = -$0.03
Step 4: Total change ≈ $1.10 + (-$0.006) + (-$0.03) = $1.064
Therefore, the option's value will increase by approximately $1.06, primarily driven by the positive stock price movement, partially offset by time decay and falling volatility.
This demonstrates how multiple Greeks interact simultaneously. The positive stock movement had the largest impact (delta effect), while the decrease in volatility hurt the position (negative vega), and time decay also reduced value (negative theta). Understanding all Greeks helps predict how option prices will behave under various market conditions.
Delta: Sensitivity to underlying price changes
Theta: Time decay (negative for long options)
Vega: Sensitivity to volatility changes
• Delta approximates probability of option expiring ITM
• Theta accelerates near expiration
• Vega is highest for at-the-money options
• Monitor all Greeks, not just one
• Greeks change as market conditions evolve
• Use Greeks for risk management
• Only considering delta and ignoring other Greeks
• Forgetting that Greeks are not constant
• Misinterpreting the signs of Greek values
Which of the following best describes the "volatility smile" phenomenon in options markets?
The answer is B) Out-of-the-money options have higher implied volatility than at-the-money options. The volatility smile refers to the pattern where both deep in-the-money and deep out-of-the-money options have higher implied volatilities than at-the-money options, creating a "smile" shape when plotted against strike prices. This contradicts the Black-Scholes assumption of constant volatility across strikes.
The volatility smile reflects market participants' awareness that extreme price movements occur more frequently than predicted by the log-normal distribution assumed in Black-Scholes. Investors demand higher premiums for options that provide protection against or exposure to tail events, leading to higher implied volatilities for extreme strikes. This is particularly pronounced around earnings or other event dates.
Volatility Smile: U-shaped pattern of implied volatility vs strike price
Out-of-the-Money (OTM): Strike far from current price
Tail Risk: Probability of extreme price movements
• Smile reflects market's non-lognormal expectations
• OTM options often have higher IV than ATM
• Smile is more pronounced for equity indices
• Smile indicates market's fear of extreme moves
• More pronounced before earnings/events
• Affects option strategy selection
• Assuming constant volatility across all strikes
• Ignoring smile when pricing complex strategies
• Thinking smile is always symmetric
FAQ
Q: How does implied volatility differ from historical volatility, and why is it important for options pricing?
A: Implied volatility (IV) and historical volatility (HV) serve different purposes in options trading:
Historical Volatility: Measures actual price fluctuations of the underlying asset over a specific past period. It's calculated using standard deviation of returns.
Implied Volatility: Represents the market's expectation of future volatility, derived from current option prices using pricing models like Black-Scholes.
The mathematical relationship in Black-Scholes shows how IV determines option prices:
\( C = S_0 N(d_1) - K e^{-rT} N(d_2) \)
Where \( d_1 = \frac{\ln(S_0/K) + (r + \sigma^2/2)T}{\sigma\sqrt{T}} \) and \( \sigma \) is the implied volatility we're solving for.
Traders use IV to assess whether options are relatively expensive or cheap compared to historical norms, helping them decide when to buy or sell options.
Q: What are the "Greeks" and how do they help manage options positions?
A: The Greeks are sensitivity measures that quantify how option prices change with various factors:
- Delta (\( \Delta \)): \( \frac{\partial C}{\partial S} \) - Change in option price per $1 change in underlying price
- Gamma (\( \Gamma \)): \( \frac{\partial^2 C}{\partial S^2} \) - Rate of change of delta
- Theta (\( \Theta \)): \( \frac{\partial C}{\partial t} \) - Time decay per day
- Vega (\( \nu \)): \( \frac{\partial C}{\partial \sigma} \) - Sensitivity to volatility changes
- Rho (\( \rho \)): \( \frac{\partial C}{\partial r} \) - Sensitivity to interest rate changes
These metrics help traders understand and manage their risk exposure. For example, a trader with positive vega profits when implied volatility increases, while negative theta means the position loses value daily due to time decay.