Childcare Cost Calculator
Fast planning tool • 2026 rates
Childcare Cost Formula:
Show the calculator\( C = (H \times R) \times W \times M \times (1 + A) \times (1 - D) \)
Where:
- \( C \) = Total Childcare Cost
- \( H \) = Hours per week
- \( R \) = Hourly Rate
- \( W \) = Weeks per year
- \( M \) = Number of children
- \( A \) = Annual increase rate (inflation)
- \( D \) = Discount factor (sibling, employer, etc.)
This formula calculates the comprehensive childcare cost by multiplying hours, rate, and duration, adjusted for multiple children, inflation, and discounts.
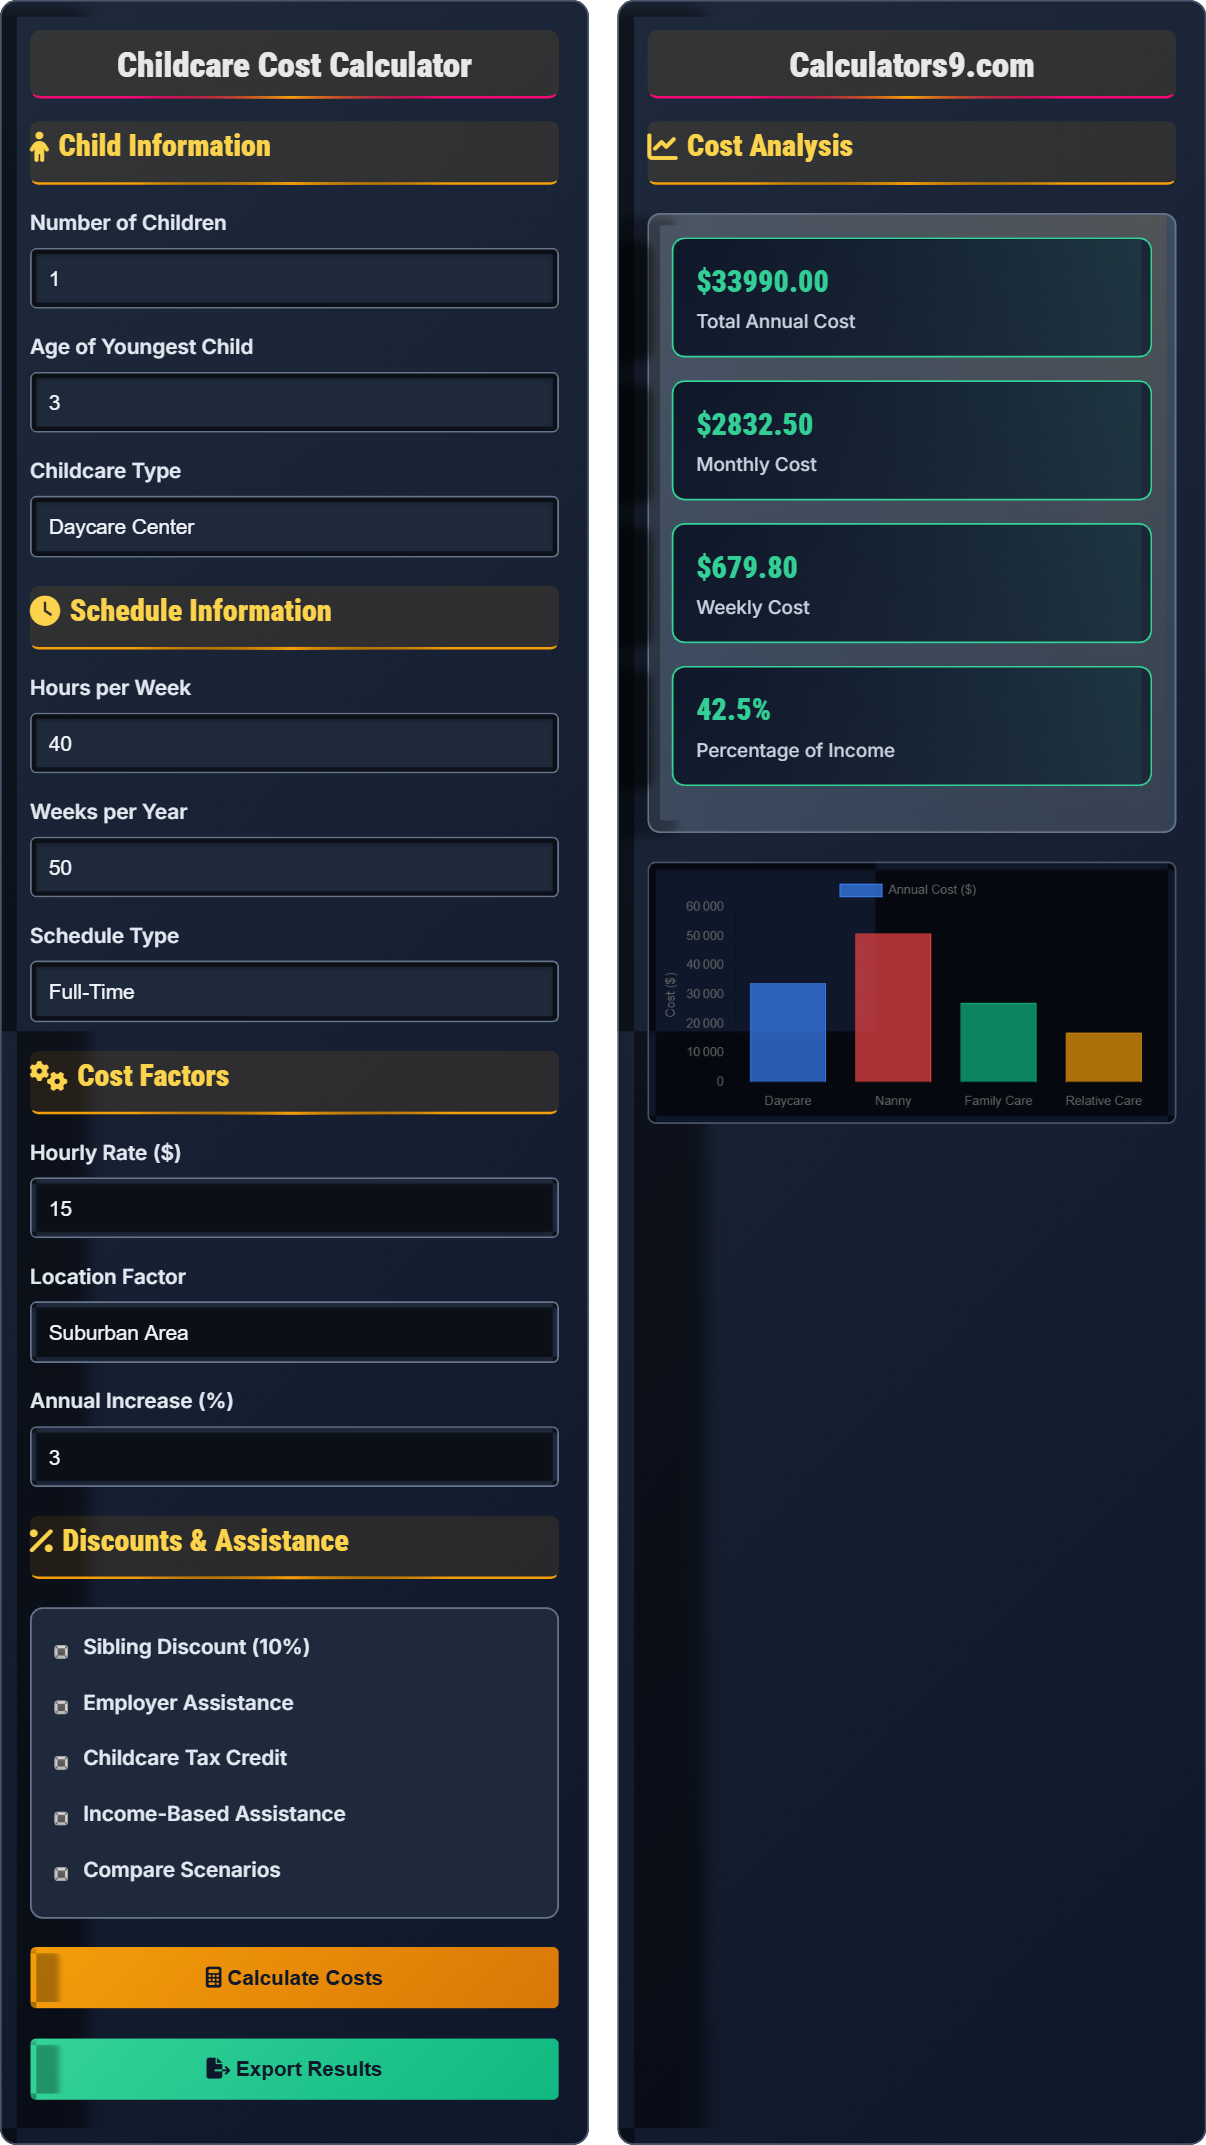
Example: For 40 hours/week at $15/hour, 50 weeks/year, 2 children, 3% annual increase, and 10% discount:
\( C = (40 \times 15) \times 50 \times 2 \times (1 + 0.03) \times (1 - 0.10) \)
\( C = 600 \times 50 \times 2 \times 1.03 \times 0.90 = \$55,620 \)
Thus, the annual childcare cost would be approximately $55,620.
Child Information
Schedule Information
Cost Factors
Discounts & Assistance
Cost Analysis
| Component | Amount | Percentage |
|---|
| Strategy | Potential Savings | Implementation |
|---|
| Year | Cost | Cumulative |
|---|
Comprehensive Childcare Planning Guide
Childcare costs represent one of the largest expenses for families with young children. Understanding how these costs are calculated helps families plan effectively and identify opportunities for savings.
Childcare costs are calculated using:
Where:
- \( C \) = Total Childcare Cost
- \( H \) = Hours per week
- \( R \) = Hourly Rate
- \( W \) = Weeks per year
- \( M \) = Number of children
- \( A \) = Annual increase rate
- \( D \) = Discount factor
Childcare costs vary significantly by location:
- Massachusetts: $1,656/month for infant care
- California: $1,588/month for infant care
- New York: $1,484/month for infant care
- Wyoming: $483/month for infant care
- Mississippi: $548/month for infant care
- Oklahoma: $621/month for infant care
- Shared Care: Split costs with another family for a nanny or babysitter
- Cooperative Care: Organize with other parents to share childcare duties
- Family Care: Use relatives or close friends for reduced rates
- Flexible Scheduling: Adjust work hours to reduce childcare hours needed
- Childcare Tax Credits: Take advantage of federal and state tax credits
- Employer Benefits: Utilize workplace childcare assistance programs
Childcare Planning Learning Quiz
Which factor typically has the GREATEST impact on childcare costs?
The answer is B) Age of the child. Infant care typically costs 2-3 times more than care for school-age children due to higher staff-to-child ratios, specialized training required, and additional safety considerations. For example, infants require 1:3 or 1:4 ratios while school-age children can have 1:8 or 1:10 ratios.
Understanding cost factors is crucial for financial planning. The age of the child is the primary determinant because it directly affects staffing requirements, which represent the largest operational cost for childcare providers. This knowledge helps families anticipate costs as their children grow and move between different care levels.
Staff-to-Child Ratio: Regulatory requirement for number of caregivers per number of children
Operational Costs: Expenses required to run the childcare facility
Specialized Training: Additional qualifications required for caring for infants
• Infants require highest staff-to-child ratios
Calculate the annual childcare cost for 2 children, each needing 35 hours per week at $12/hour, for 48 weeks per year, with 5% annual increase and 10% sibling discount. Show your work.
Using the cost formula: \( C = (H \times R) \times W \times M \times (1 + A) \times (1 - D) \)
Given:
- H = 35 hours/week
- R = $12/hour
- W = 48 weeks/year
- M = 2 children
- A = 0.05 (5% annual increase)
- D = 0.10 (10% sibling discount)
Step 1: Calculate base weekly cost: (35 × 12) = $420
Step 2: Calculate base annual cost: $420 × 48 × 2 = $40,320
Step 3: Apply annual increase: $40,320 × (1 + 0.05) = $42,336
Step 4: Apply sibling discount: $42,336 × (1 - 0.10) = $38,102.40
The annual childcare cost is $38,102.40
This calculation demonstrates how multiple factors compound to determine childcare costs. The annual increase is applied before the discount, showing how timing affects the final cost. The sibling discount is calculated as a reduction of the total cost, not per child, which maximizes the benefit for families with multiple children.
Annual Increase: Adjustment for inflation and rising operational costs
Sibling Discount: Reduced rate for additional children from same family
Base Cost: Initial calculation before adjustments
• Annual increases typically applied before discounts
• Sibling discounts often apply to additional children
• Costs compound with multiple children
• Calculate costs per hour to compare different options
• Consider full-year vs. school-year costs
• Factor in additional fees (registration, supplies, etc.)
• Forgetting to apply annual increases
• Not accounting for all children in discount calculations
• Overlooking additional fees beyond hourly rates
Sarah needs childcare for her 2-year-old and 4-year-old. Daycare costs $15/hour for 40 hours/week, while a nanny costs $20/hour for 50 hours/week. The daycare offers a 15% sibling discount, while the nanny does not. Calculate the annual cost difference between the two options.
Step 1: Calculate daycare cost
Base cost: (40 × $15) × 50 weeks × 2 children = $60,000
With 15% sibling discount: $60,000 × (1 - 0.15) = $51,000
Step 2: Calculate nanny cost
Base cost: (50 × $20) × 50 weeks × 1 child = $50,000
(Note: Nanny typically cares for both children at once)
Step 3: Compare costs
Daycare: $51,000
Nanny: $50,000
Difference: $51,000 - $50,000 = $1,000
Step 4: Conclusion
The nanny is $1,000 less expensive annually than daycare. However, this comparison doesn't account for taxes, benefits, or additional responsibilities the nanny might have.
This example demonstrates the importance of comparing all factors when choosing childcare. The sibling discount significantly reduces daycare costs, making it competitive with nannies. However, other factors like quality of care, flexibility, and additional services should also be considered in the decision-making process.
Cost Comparison: Analysis of different childcare options
Opportunity Cost: Value of alternative uses of money spent on childcare
Hidden Costs: Expenses not immediately obvious in childcare arrangements
• Factor in all costs when comparing options
• Consider non-monetary benefits of each option
• Account for scheduling flexibility needs
• Calculate cost per hour for apples-to-apples comparison
• Consider tax implications of different childcare types
• Factor in transportation costs if applicable
• Only comparing hourly rates without considering total hours
• Forgetting to apply sibling discounts
• Not accounting for differences in care quality
Mike and Lisa earn $120,000 combined annually. They need full-time childcare for their 18-month-old at $18/hour for 45 hours/week. Childcare costs increase 4% annually. If they want to keep childcare costs below 20% of their income, for how many years can they afford this arrangement?
Step 1: Calculate current annual childcare cost
Weekly cost: 45 hours × $18/hour = $810
Annual cost: $810 × 50 weeks = $40,500
Step 2: Calculate maximum affordable childcare
20% of income: $120,000 × 0.20 = $24,000
Step 3: Compare current cost to maximum
Current cost: $40,500
Maximum affordable: $24,000
Step 4: Calculate years before exceeding budget
Using the formula: \( C_n = C_0 \times (1 + r)^n \)
Where \( C_n \) = cost in year n, \( C_0 \) = initial cost, \( r \) = annual increase rate, \( n \) = number of years
We need to find when \( C_n = 24,000 \):
Since $40,500 > $24,000, they are already exceeding their budget by $16,500.
They cannot afford this arrangement within their 20% budget constraint.
This problem demonstrates the importance of budget planning for childcare. The example shows that childcare costs can easily exceed recommended percentages of income, especially for families with young children requiring full-time care. This highlights the need for careful financial planning and consideration of alternative arrangements when necessary.
Budget Constraint: Maximum amount that can be allocated to childcare
Percentage of Income: Recommended guideline for childcare expenses
Compounding Growth: How costs increase over time
• Childcare should ideally not exceed 10-15% of income
• Costs compound annually with inflation
• Budget planning must account for cost increases
• Plan childcare costs before having children
• Consider phased return to work to reduce hours
• Explore multiple childcare options
• Underestimating childcare costs
• Not accounting for annual cost increases
• Forgetting to factor in childcare when accepting jobs
What is the maximum Child and Dependent Care Credit for 2026?
The answer is C) 35% of up to $3,000 per child (up to $6,000 for 2+ children). The Child and Dependent Care Credit allows eligible taxpayers to claim a percentage of qualifying expenses for the care of children under age 13 or other dependents who live with them. The credit percentage varies based on adjusted gross income, ranging from 20% to 35%.
Understanding tax benefits for childcare can significantly reduce net costs. The Child and Dependent Care Credit provides a dollar-for-dollar reduction in tax liability, making it more valuable than a deduction. Families should explore all available tax benefits when planning childcare budgets.
Tax Credit: Dollar-for-dollar reduction in tax liability
Tax Deduction: Reduction in taxable income
Qualifying Expenses: Childcare costs that meet IRS requirements
• Credit percentage decreases with higher income
Childcare Basics
Supervision and care of children when parents are unavailable.
\( C = (H \times R) \times W \times M \times (1 + A) \times (1 - D) \)
Where C=cost, H=hours, R=rate, W=weeks, M=number of children, A=annual increase, D=discounts.
- Infants cost 2-3x more than school-age children
- Urban areas typically have higher costs
- Sibling discounts are common
Cost Factors
Infant care costs significantly more than toddler/preschool care.
- Location: Urban > Suburban > Rural
- Quality: Higher-rated facilities cost more
- Hours: Full-time vs. part-time pricing
- Seasonal: Summer camps and holiday care
- Special Needs: Additional care requirements
- Childcare should not exceed 10-15% of income
- Factor in tax benefits and employer assistance
- Consider quality vs. cost trade-offs
- Plan for annual cost increases
FAQ
Q: How much should I budget for childcare?
A: Financial experts recommend spending no more than 10-15% of your gross household income on childcare. The Childcare.gov suggests 7% as ideal and 20% as the maximum.
For example, if your household income is $80,000:
- 10% budget: $8,000 annually
- 15% budget: $12,000 annually
- 20% budget: $16,000 annually
Mathematically, if your annual income is \( I \) and you want to keep childcare at \( p \% \) of income, then your maximum childcare budget is: \( \text{Budget} = I \times \frac{p}{100} \).
For the example above: \( \text{Budget} = 80000 \times 0.15 = \$12,000 \) annually.
However, many families spend 20-30% of their income on childcare, especially in expensive metropolitan areas, which can create significant financial strain.
Q: What childcare benefits can employers offer?
A: Employers can offer several childcare benefits:
- Dependent Care FSA: Pre-tax contributions up to $5,000 per year
- On-site childcare: Company-provided childcare facilities
- Childcare subsidies: Direct financial assistance for employees
- Flexible schedules: Allows for shared childcare responsibilities
- Backup childcare: Emergency care for sick children
For a Dependent Care FSA, if an employee contributes the maximum $5,000 pre-tax and is in the 22% tax bracket, they save approximately $1,100 in federal taxes (22% × $5,000). The actual benefit is: \( \text{Tax Savings} = \text{FSA Contribution} \times \text{Tax Rate} \).
For the example: \( 5000 \times 0.22 = \$1,100 \) in federal tax savings, plus potential state tax savings.
These benefits are attractive to employees and may be tax-deductible for employers.