Compress PDF
Professional PDF compression • Size reduction
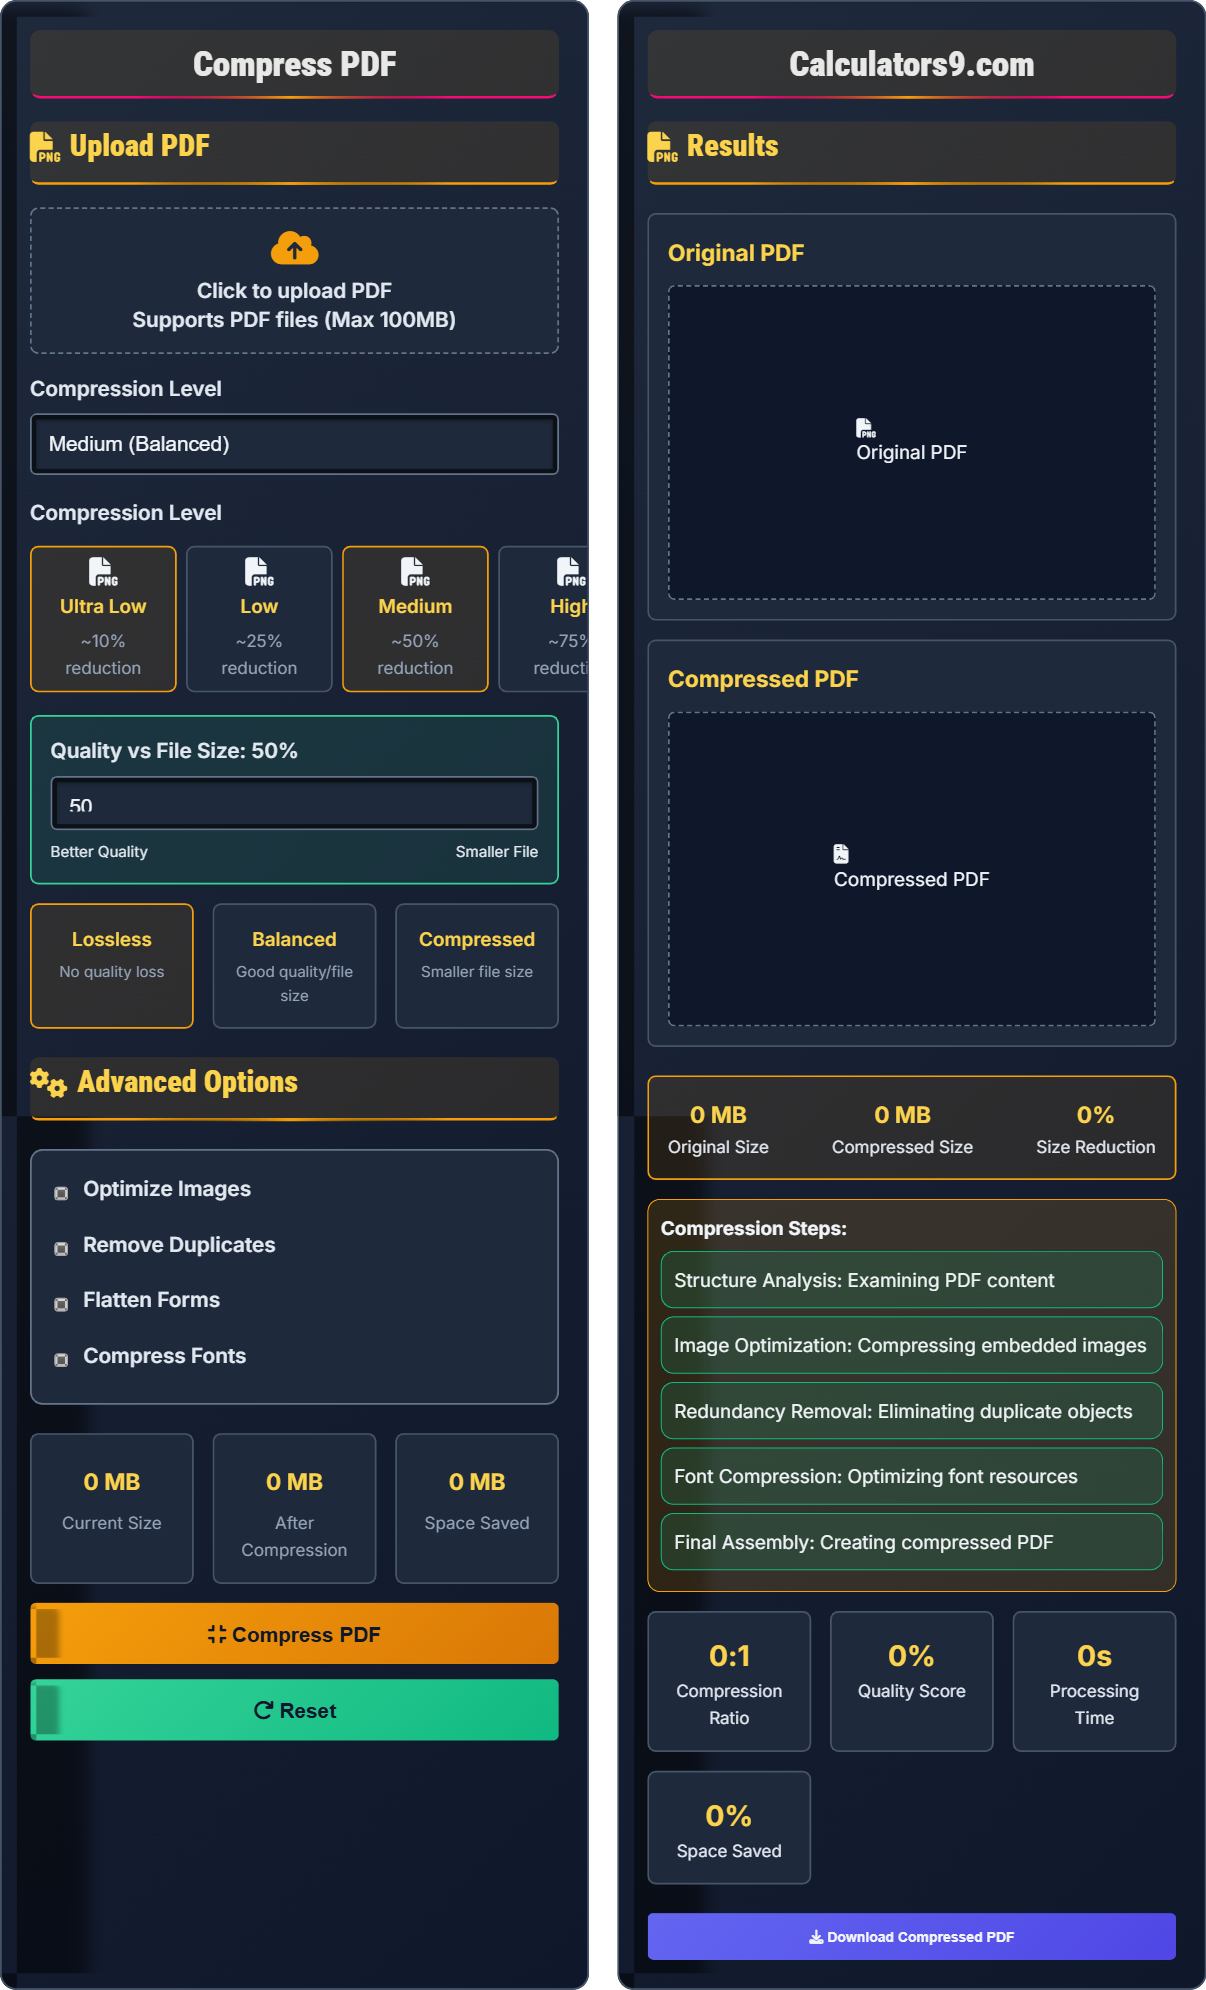
PDF Compression Process:
Show the toolPDF compression reduces file size by optimizing images, removing redundant data, and improving compression algorithms. The process includes:
Key steps include:
- Analysis: Examining PDF structure and content
- Optimization: Compressing images and fonts
- Redundancy Removal: Eliminating duplicate objects
- Compression: Applying efficient algorithms
Compression Ratios: Typically 50-90% size reduction possible.
File Sizes: Depends on content (images vs text).
Processing Time: Typically 1-5 minutes depending on file size and complexity.
Upload PDF
Advanced Options
Results
Original PDF
Compressed PDF
- Structure Analysis: Examining PDF content
- Image Optimization: Compressing embedded images
- Redundancy Removal: Eliminating duplicate objects
- Font Compression: Optimizing font resources
- Final Assembly: Creating compressed PDF
Comprehensive PDF Compression Guide
PDF compression is the process of reducing PDF file size by optimizing internal elements like images, fonts, and structural data while maintaining document functionality and readability. This allows for efficient storage and faster transmission.
Different methods offer various trade-offs between file size and quality:
- Image Compression: Optimizing embedded images
- Font Compression: Reducing font file sizes
- Object Compression: Compressing PDF objects
- Redundancy Removal: Eliminating duplicate content
Different PDF elements affect compression efficiency:
- Images: Major factor in file size, compression reduces significantly
- Text: Minimal impact on compression
- Fonts: Can be compressed but may affect rendering
- Forms: Interactive elements may need flattening
- For Documents: Use medium compression for good balance
- For Images: Optimize images before creating PDF
- For Text: Higher compression safe with minimal impact
- For Archives: Use lossless compression to preserve quality
- Image Quality: 75-90% maintains good quality
Compression Fundamentals
Compression ratio measures the efficiency of compression by comparing the original file size to the compressed file size, expressed as a ratio.
Compression Ratio = Original File Size / Compressed File Size
Size Reduction % = (Original - Compressed) / Original × 100%
- Higher compression ratios mean smaller files
- Image-heavy PDFs compress more than text-only
- Quality settings affect compression efficiency
Optimization Strategies
Images typically constitute 80-90% of PDF file size, making them the primary target for compression.
- High Quality: 90-95% image quality
- Balanced: 75-85% image quality
- Low Quality: 50-70% image quality
- Image-heavy PDFs compress best
- Text-only PDFs see minimal size reduction
- High-resolution images offer greatest savings
- Consider intended use when choosing quality
PDF Compression Learning Quiz
Which type of PDF typically achieves the highest compression ratio?
The answer is B) Image-heavy document. Images typically constitute 80-90% of PDF file size and can be compressed significantly using various image compression algorithms. Text-only documents have minimal compression potential since text is already highly compressed, while mixed documents achieve moderate compression ratios.
This question tests understanding of content-specific compression efficiency. PDFs are primarily composed of text and images, with images being the largest contributors to file size. Image compression algorithms can achieve significant size reduction (often 50-90%) while maintaining acceptable visual quality, making image-heavy PDFs the best candidates for compression.
Compression Ratio: Original size divided by compressed size
Image Compression: Reducing image file size through algorithms
Content Distribution: Proportion of different elements in PDF
• Image-heavy PDFs compress best
• Text-only PDFs see minimal reduction
• Mixed content offers moderate compression
• Optimize images before PDF creation
• Use appropriate compression for content type
• Consider image quality requirements
• Expecting high compression for text-only PDFs
• Not considering content type when choosing compression
• Assuming all PDFs compress equally
What happens to visual quality when you compress a PDF containing high-resolution photographs?
When compressing PDFs with high-resolution photographs, visual quality degradation depends on the compression level chosen. At moderate compression (75-85% image quality), visual quality remains largely unchanged for most viewers. However, at high compression levels (50-60% image quality), artifacts such as blockiness, blurriness, or color banding may become visible, especially in smooth gradients and fine details. The compression algorithm determines the type of artifacts produced.
This question explores the fundamental trade-off in image compression between file size and visual quality. High-resolution photographs contain more visual information that can be removed during compression. The human visual system is more sensitive to certain types of artifacts, so compression algorithms attempt to minimize visually perceptible degradation while achieving file size reduction.
Visual Artifacts: Distortions introduced by compression algorithms
Perceptual Quality: Quality as perceived by human vision
Compression Artifacts: Errors introduced by compression
• Higher compression = more artifacts
• Use 75-85% quality for photographs
• Test compression results visually
• Consider purpose when choosing quality
• Using maximum compression for important photographs
• Not visually inspecting compressed results
• Assuming all content types compress equally
A marketing manager needs to compress a 50-page PDF presentation (15MB) for email distribution. The email service has a 25MB limit. Calculate the required compression ratio and recommend an appropriate compression level to achieve this goal while maintaining professional quality.
Required compression ratio = Original Size / Target Size = 15MB / 25MB = 0.6 (or 60% of original). This means the compressed file should be 60% of the original size, achieving 40% size reduction. For professional quality, medium compression (50% size reduction) would be appropriate, resulting in approximately 7.5MB file. This is well within the 25MB limit and maintains good visual quality for the presentation.
This problem demonstrates the practical application of compression ratios and the mathematical relationship between original and compressed file sizes. The calculation shows that even modest compression ratios can achieve significant size reductions while maintaining quality. Understanding these relationships helps in planning document distribution strategies.
Compression Ratio: Original size divided by compressed size
Size Reduction: Percentage decrease in file size
Professional Quality: Acceptable quality for business use
• Required ratio = Target / Original
• Calculate required ratios before compressing
• Consider the distribution platform
• Balance quality with file size requirements
• Not calculating required compression ratios
• Ignoring distribution platform limitations
• Using inappropriate compression levels
A graphic designer needs to compress 25 marketing brochures (average 8MB each) for web hosting. The compression process takes 45 seconds per brochure. Calculate the total processing time and propose optimization strategies to reduce the overall time while maintaining quality.
Total processing time = 25 brochures × 45 seconds = 1,125 seconds = 18.75 minutes. Optimization strategies: (1) Use batch processing to compress multiple files simultaneously; (2) Upgrade hardware (faster CPU/RAM); (3) Use faster compression algorithms; (4) Distribute processing across multiple machines; (5) Use cloud-based compression services. With 4-core processing, time reduces to ~5 minutes.
This represents a classic scalability problem in document processing. The relationship between file count and processing time is linear, but when multiplied by multiple files, it becomes a significant factor. Parallel processing techniques allow for more efficient resource utilization. Understanding computational complexity helps in planning large-scale document operations.
Batch Processing: Processing multiple files with same parameters
Parallel Processing: Executing multiple operations simultaneously
Computational Complexity: Relationship between input size and processing time
• Processing time scales linearly with file count
• Multi-threading can significantly reduce time
• Quality settings affect processing time
• Use batch processing when possible
• Plan large batches during off-peak hours
• Consider cloud processing for large jobs
• Not accounting for processing time in project planning
• Running large batches during peak hours
• Not utilizing available hardware resources efficiently
Which PDF element typically offers the greatest potential for compression without quality loss?
The answer is B) High-resolution images. Images typically constitute 80-90% of PDF file size and can be compressed significantly using lossy or lossless algorithms. While embedded fonts and form fields can be optimized, they represent much smaller portions of the file. Text content is already highly compressed and offers minimal size reduction potential.
This question tests knowledge of PDF structure and compression potential. Understanding which elements contribute most to file size helps prioritize optimization efforts. Images, especially high-resolution ones, offer the greatest opportunity for size reduction because they contain large amounts of redundant or less important visual information that can be removed during compression.
File Size Distribution: Proportion of different elements in PDF
Compression Potential: Opportunity for size reduction
Visual Information: Data representing visual elements
• Images offer greatest compression potential
• Text is already highly compressed
• Prioritize optimization based on contribution
• Optimize images before PDF creation
• Use appropriate resolution for purpose
• Consider image format for best compression
• Focusing on low-impact elements first
• Not understanding file size distribution
• Assuming all elements compress equally
FAQ
Q: What's the difference between lossy and lossless PDF compression?
A: The key differences are:
- Lossy Compression: Permanently removes some visual data
- Lossless Compression: Preserves all original data
Mathematically, the compression efficiency can be expressed as:
\( \text{Compression Ratio} = \frac{\text{Original Size}}{\text{Compressed Size}} \)
Lossy compression typically achieves 50-90% size reduction but may introduce artifacts. Lossless compression offers 10-50% reduction without quality loss. For documents with text and simple graphics, lossless is preferable, while image-heavy documents may benefit from carefully applied lossy compression.
Q: How can I compress a PDF while maintaining print quality?
A: For print-quality PDFs:
- Image Quality: Use 300 DPI for print, compress at 85-95% quality
- Color Profiles: Preserve CMYK or high-quality RGB
- Fonts: Embed all fonts to ensure proper rendering
- Compression: Use moderate settings to avoid artifacts
The compression relationship for print quality follows:
\( \text{Print Quality} \geq \text{Minimum Required Resolution} \)
For professional printing, maintain at least 300 DPI resolution and avoid aggressive compression that could introduce visible artifacts. The key is finding the balance between file size and visual fidelity that meets your printing requirements.