Goal Progress Tracker
Track & achieve your goals • 2026 edition
Goal Progress Formula:
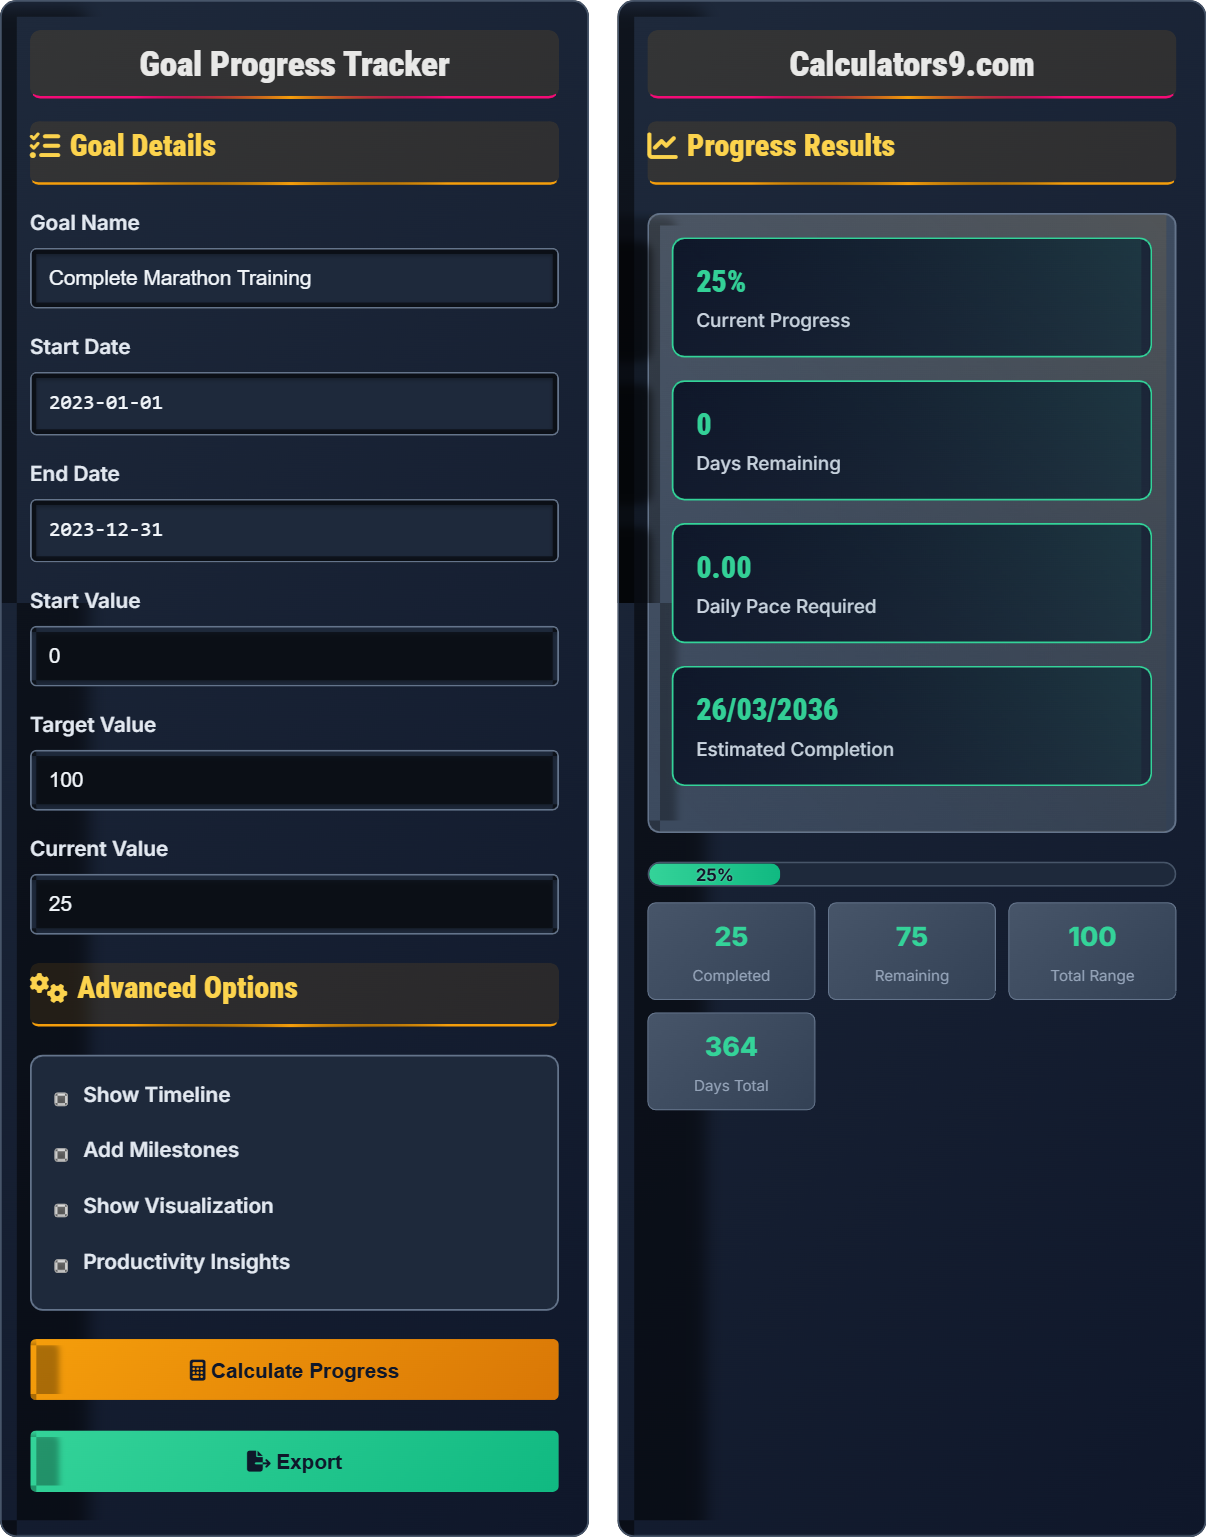
Show the calculator\( \text{Progress} = \frac{\text{Current Value} - \text{Start Value}}{\text{Target Value} - \text{Start Value}} \times 100\% \)
Where:
- Progress = Current percentage completion
- Current Value = Current state of your goal
- Start Value = Initial state when you started
- Target Value = Desired end state
This formula calculates the percentage completion of your goal by comparing your current progress to the total distance between start and target.
Example: If your goal is to read 100 books in a year and you've read 25 books starting from 0:
\( \text{Progress} = \frac{25 - 0}{100 - 0} \times 100\% = 25\% \)
Thus, you're 25% of the way to achieving your reading goal.
Goal Details
Advanced Options
Progress Results
Goal Tracking Fundamentals
Goal tracking is the systematic monitoring of progress toward achieving specific objectives. It involves setting measurable targets, regularly measuring performance, and adjusting strategies to ensure successful completion.
\( \text{Progress} = \frac{\text{Current Value} - \text{Start Value}}{\text{Target Value} - \text{Start Value}} \times 100\% \)
Where Progress=percentage completion, Current=actual progress, Start=initial value, Target=desired end state.
- Set specific, measurable goals
- Track progress regularly
- Break large goals into milestones
- Review and adjust strategies
Effective Strategies
Goals should be Specific, Measurable, Achievable, Relevant, and Time-bound.
- Define clear milestones
- Establish daily habits
- Track consistently
- Celebrate achievements
- Regular progress reviews
- Accountability systems
- Flexible planning
- Positive reinforcement
Goal Tracking Learning Quiz
Which of the following best represents the formula for calculating goal progress percentage?
The answer is B) (Current - Start) / (Target - Start) × 100%. This formula calculates the percentage of the journey completed from the starting point to the target. The numerator represents how far you've progressed from the start, and the denominator represents the total distance from start to target.
This formula measures progress as a fraction of the total journey. Think of it as measuring how far along a path you are. If you start at mile 0 and aim for mile 100, reaching mile 25 means you've covered 25% of the total distance. The formula normalizes your progress against the total goal range.
Progress Percentage: The proportion of the goal achieved relative to the total range
Start Value: The initial state when the goal tracking began
Target Value: The desired end state of the goal
• Always subtract the start value from both current and target values
• The denominator represents the total range of the goal
• Progress cannot exceed 100% without surpassing the target
• Remember: Progress = Distance Covered / Total Distance
• Use this formula to set milestones at regular intervals (25%, 50%, 75%)
• Forgetting to account for the start value when it's not zero
• Dividing by the wrong range (target only instead of target-start)
Explain how to plan effective milestones for a goal that spans 6 months. Provide an example with a fitness goal to lose 30 pounds.
Effective milestone planning involves dividing your goal into manageable segments that provide motivation and accountability checkpoints. For a 6-month goal to lose 30 pounds:
Step 1: Calculate total duration: 6 months = 26 weeks
Step 2: Determine reasonable milestones: Every 1.5 months (6 weeks)
Step 3: Set milestone values: 30 lbs / 4 milestones = 7.5 lbs per milestone
Step 4: Plan specific milestones:
- Milestone 1 (Week 6): Lose 7.5 lbs
- Milestone 2 (Week 12): Lose 15 lbs
- Milestone 3 (Week 18): Lose 22.5 lbs
- Milestone 4 (Week 26): Lose 30 lbs
This creates 4 checkpoints that help track progress and maintain motivation.
Milestones serve as intermediate goals that break down larger objectives into achievable steps. They provide psychological rewards and opportunities to reassess strategy. The key is spacing them appropriately so they're challenging but attainable, creating a rhythm of success.
Milestones: Significant checkpoints that mark progress toward a larger goal
Goal Segmentation: Dividing a large goal into smaller, measurable parts
Accountability Checkpoints: Regular intervals to assess progress
• Milestones should be evenly spaced in time
• Each milestone should represent equal progress toward the goal
• Allow flexibility for adjustments if needed
• Use the "Rule of Four": Divide long-term goals into 4 major milestones
• Celebrate each milestone achievement
• Document progress at each milestone
• Setting too many milestones (overwhelming)
• Setting milestones too far apart (lack of accountability)
• Not adjusting milestones when circumstances change
Sarah wants to read 50 books in 200 days. She has already read 12 books in the first 40 days. At this rate, how many books per day does she need to read for the remainder of the period to achieve her goal? Is her current pace sufficient?
Step 1: Calculate remaining books needed = 50 - 12 = 38 books
Step 2: Calculate remaining days = 200 - 40 = 160 days
Step 3: Calculate required daily pace = 38 books / 160 days = 0.2375 books/day
Step 4: Calculate current pace = 12 books / 40 days = 0.3 books/day
Conclusion: Yes, her current pace of 0.3 books per day is sufficient since it exceeds the required pace of 0.2375 books per day. At her current pace, she will finish early.
This problem demonstrates the importance of recalculating required pace based on actual progress. Even though Sarah is ahead of schedule, knowing the required pace helps ensure continued progress. The calculation shows how past performance affects future requirements.
Daily Pace: The average amount of progress needed per day
Required Pace: The minimum rate needed to achieve the goal
Actual Pace: The rate of progress already achieved
• Required pace = Remaining work / Remaining time
• Compare actual pace to required pace regularly
• Adjust strategies if actual pace falls below required pace
• Calculate required pace weekly to stay on track
• Build in buffer time for unexpected delays
• Track both completed and planned progress
• Forgetting to account for progress already made
• Calculating pace based on original timeline instead of remaining time
• Not adjusting for variations in daily capacity
Mark started a goal to write 1,000 pages in 12 months starting January 1. By June 1 (day 151), he has written 300 pages. However, he realizes he needs to finish by October 1 (day 274 from start). How many pages per day must he now write to complete the goal by the new deadline? What percentage of his original timeline remains?
Step 1: Calculate remaining pages = 1,000 - 300 = 700 pages
Step 2: Calculate remaining days = 274 - 151 = 123 days
Step 3: Calculate required daily pace = 700 pages / 123 days = 5.69 pages/day
Step 4: Calculate original timeline percentage remaining:
Original deadline: 365 days
Days remaining in original timeline: 365 - 151 = 214 days
New deadline: 274 days
Percentage of original timeline remaining when new deadline is set: (274 - 151) / 214 = 57.5%
Therefore, Mark needs to write approximately 5.69 pages per day to meet his accelerated deadline, and he has 57.5% of his original timeline remaining when he sets the new deadline.
This problem demonstrates how goal adjustments affect required effort. When deadlines are moved forward, the required pace increases significantly. The calculation shows how much more intensive the remaining work must be compared to the original plan.
Goal Adjustment: Modifying deadlines or targets after work has begun
Pace Acceleration: Increasing the rate of work to meet a tighter deadline
Timeline Compression: Reducing the time available to complete a goal
• When deadlines are shortened, required pace increases proportionally
• Always recalculate required pace after goal adjustments
• Consider feasibility of increased pace before committing to new deadlines
• Build buffer time into original timelines
• Assess resource availability before accepting accelerated deadlines
• Break accelerated goals into smaller daily targets
• Underestimating the impact of timeline compression on required effort
• Not accounting for fatigue when increasing daily pace
• Failing to verify feasibility of accelerated pace
Which of the following visualization methods best represents the relationship between time and goal completion?
The answer is B) Line graph showing cumulative progress over time. A line graph with time on the x-axis and cumulative progress on the y-axis best visualizes the relationship between time and goal completion. It shows the trajectory of progress, allows comparison to ideal progress lines, and reveals trends in performance over the goal period.
Line graphs are ideal for showing continuous progress over time because they reveal patterns, acceleration, deceleration, and deviations from planned progress. Unlike static representations like pie charts, line graphs capture the temporal dynamics of goal achievement, which is crucial for understanding performance trends.
Progress Visualization: Graphical representation of goal achievement over time
Cumulative Progress: Total progress accumulated over time
Temporal Dynamics: How progress changes over time
• Time-based visualizations require continuous data over periods
• Line graphs show trends and patterns effectively
• Include target progress lines for comparison
• Overlay ideal progress line with actual progress
• Use different colors for completed, in-progress, and remaining work
• Include milestone markers on the timeline
• Using static visualizations for dynamic processes
• Not including time context in progress visualizations
• Failing to show trends and patterns in performance
FAQ
Q: How often should I update my goal progress to stay motivated?
A: Research suggests that daily tracking provides the best motivation for most goals. The formula for progress is: \( \text{Progress} = \frac{\text{Current Value} - \text{Start Value}}{\text{Target Value} - \text{Start Value}} \times 100\% \).
Daily updates create a feedback loop that reinforces positive behavior. Weekly check-ins are acceptable for longer-term goals, but daily micro-tracking (even just 2-3 minutes) maintains momentum.
For example, if your goal is to write 100 pages in 30 days, tracking daily ensures you maintain an average of 3.33 pages per day. Missing days creates pressure to catch up, while consistent daily progress builds sustainable habits.
Q: What's the optimal number of milestones for a 6-month goal?
A: For a 6-month goal, 4-6 milestones are optimal. This creates checkpoints every 4-6 weeks, providing enough frequency to maintain motivation without overwhelming complexity.
For example, in a 6-month project to learn a new skill (target value = 100%), effective milestones would be:
- Month 1: 15% (foundation knowledge)
- Month 2: 30% (basic skills)
- Month 3: 50% (intermediate skills)
- Month 4: 70% (advanced practice)
- Month 5: 90% (refinement)
- Month 6: 100% (mastery demonstration)
This spacing provides regular wins while maintaining sight of the ultimate objective.