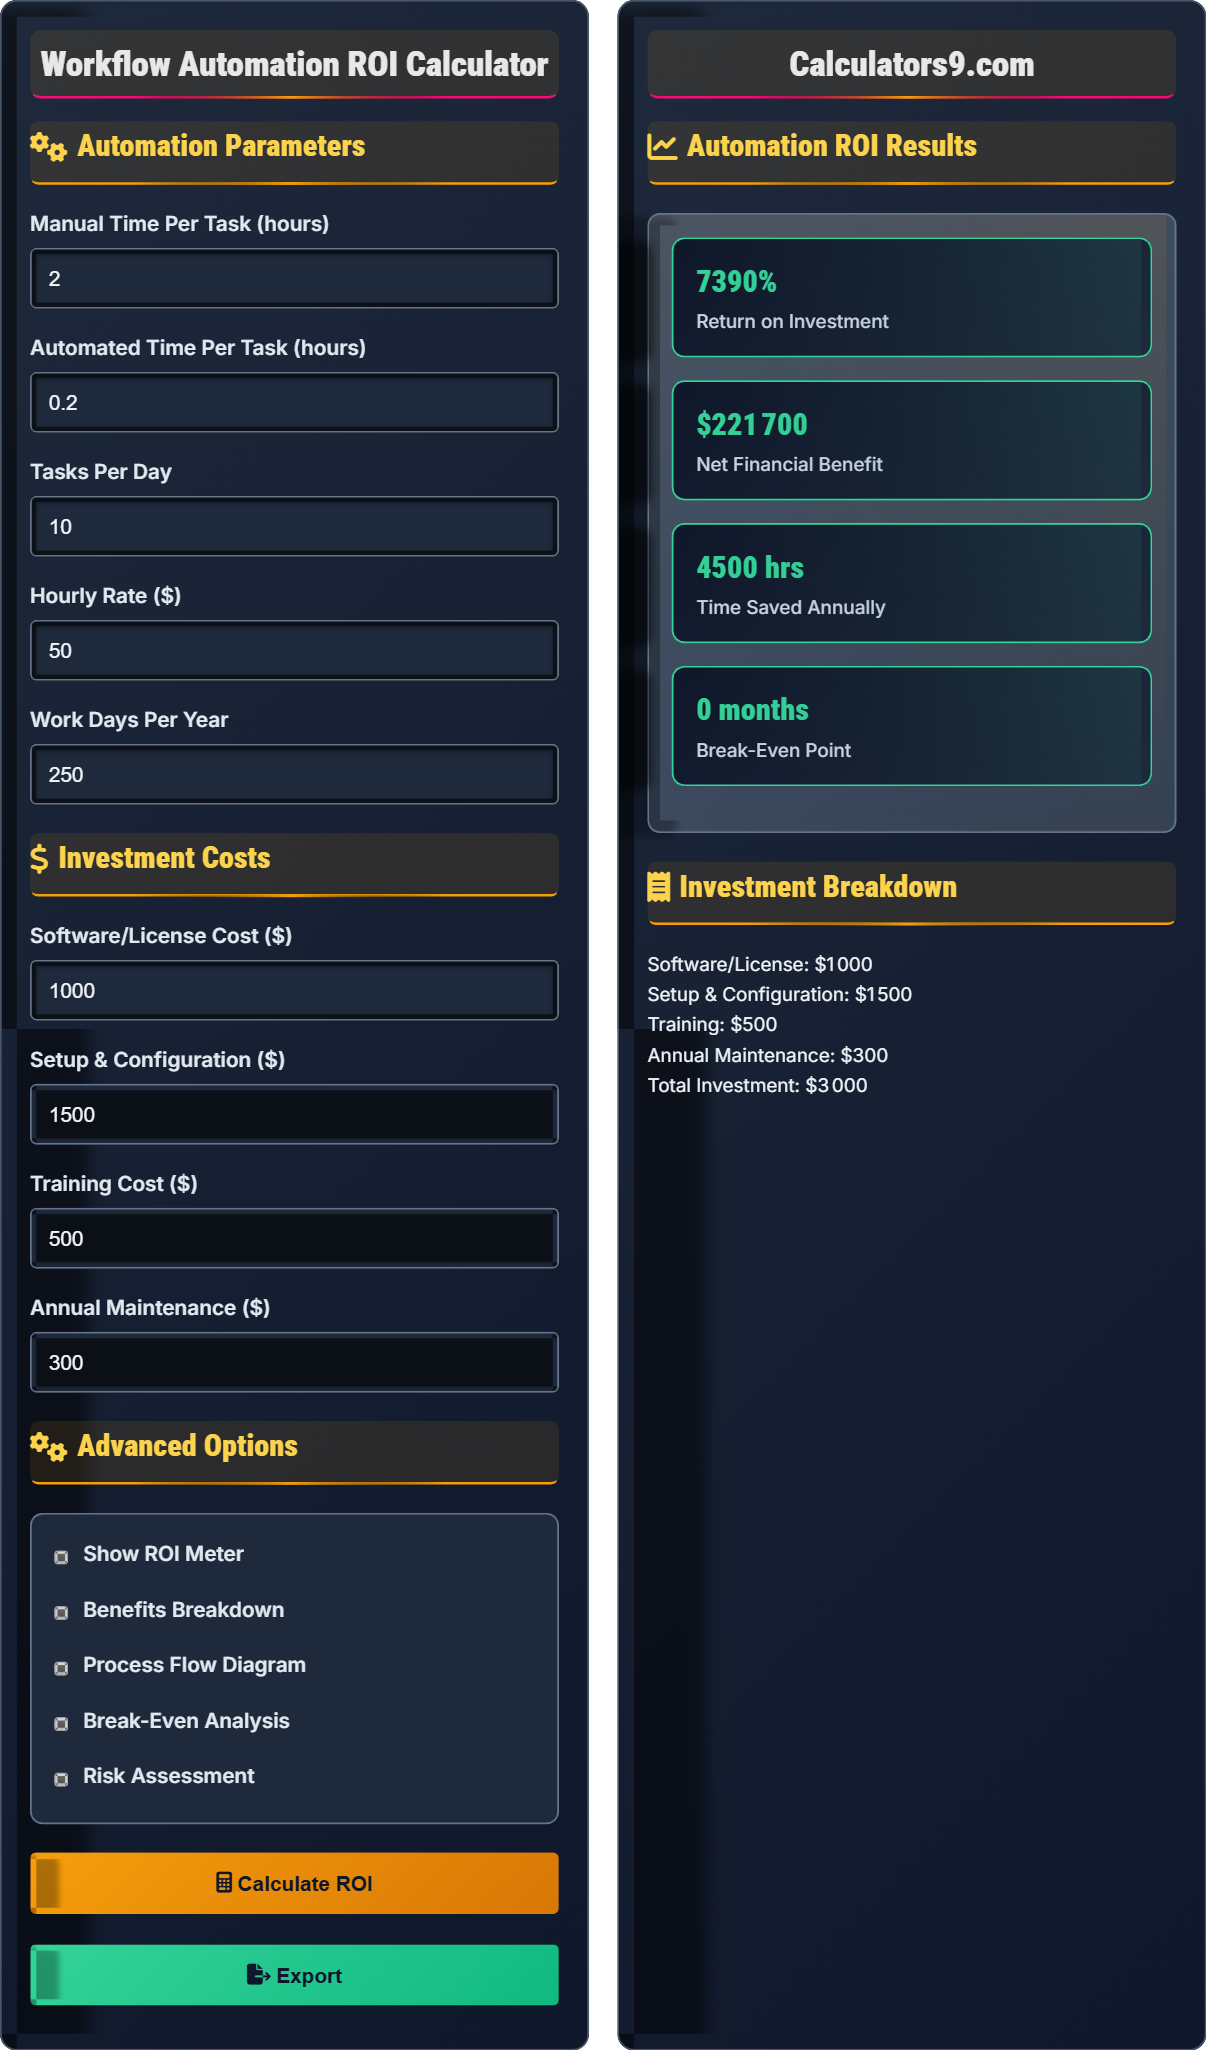
Workflow Automation ROI Calculator
Calculate automation benefits • 2026 edition
Automation ROI Formula:
Show the calculator\( \text{ROI} = \frac{\text{Net Benefit}}{\text{Total Investment}} \times 100\% \)
Where:
- Net Benefit = (Time Saved × Hourly Rate × Work Days) - Total Investment
- Time Saved = Manual Time - Automated Time
- Total Investment = Software + Setup + Training + Maintenance
- ROI = Return on Investment percentage
This formula calculates the return on investment for workflow automation by comparing the value of time saved to the total cost of implementation.
Example: If automating a task saves 2 hours per day, with an hourly rate of $50, over 250 work days, and the total investment is $5,000:
\( \text{Time Saved} = 2 \text{ hours/day} \times 250 \text{ days} = 500 \text{ hours} \)
\( \text{Value of Time Saved} = 500 \text{ hours} \times \$50/\text{hour} = \$25,000 \)
\( \text{Net Benefit} = \$25,000 - \$5,000 = \$20,000 \)
\( \text{ROI} = \frac{\$20,000}{\$5,000} \times 100\% = 400\% \)
Thus, the automation provides a 400% return on investment.
Automation Parameters
Investment Costs
Advanced Options
Automation ROI Results
Investment Breakdown
Automation ROI Fundamentals
Automation ROI measures the financial return from implementing workflow automation compared to the total investment required. It quantifies the value gained from time savings, error reduction, and efficiency improvements.
\( \text{ROI} = \frac{\text{Net Benefit}}{\text{Total Investment}} \times 100\% \)
Where Net Benefit = (Time Saved × Hourly Rate × Work Days) - Total Investment, Total Investment = Software + Setup + Training + Maintenance.
- ROI above 100% indicates positive return
- Consider both tangible and intangible benefits
- Factor in ongoing maintenance costs
- Account for scalability advantages
Implementation Strategies
Focus on repetitive, rule-based processes with high volume and manual effort for maximum ROI.
- Identify and prioritize processes
- Quantify current manual effort
- Select appropriate tools
- Plan rollout strategy
- Train staff and monitor results
- Executive sponsorship
- User involvement
- Change management
- Ongoing optimization
Automation ROI Learning Quiz
Which of the following represents the correct formula for calculating ROI in automation projects?
The answer is A) (Net Benefit / Total Investment) × 100%. ROI is calculated by dividing the net benefit (return) by the total investment and multiplying by 100 to get a percentage. This measures how much return you get for each dollar invested.
ROI stands for Return on Investment, which means we're measuring the return relative to the investment. The formula compares the profit (net benefit) to the initial cost (investment). A higher ROI percentage indicates a more profitable investment relative to its cost.
Return on Investment (ROI): A measure of profitability expressed as a percentage
Net Benefit: Total gains minus total costs
Total Investment: All costs associated with the investment
• ROI is always calculated as return divided by investment
• Net benefit = gross benefit minus total investment
• ROI above 100% indicates positive returns
• Remember: ROI = (Gain - Cost) / Cost × 100%
• Compare ROIs across different automation opportunities
• Include both direct and indirect benefits in calculations
• Reversing the numerator and denominator
• Forgetting to subtract costs from benefits
• Not accounting for ongoing operational costs
Calculate the ROI for an automation project that costs $15,000 to implement (software, setup, training) and saves 3 hours per day. The employee's hourly rate is $45, and they perform this task 220 days per year. Include $1,000 annual maintenance costs.
Step 1: Calculate time saved annually = 3 hours/day × 220 days = 660 hours
Step 2: Calculate value of time saved = 660 hours × $45/hour = $29,700
Step 3: Calculate first-year net benefit = $29,700 - $15,000 (initial) - $1,000 (maintenance) = $13,700
Step 4: Calculate ROI = ($13,700 / $15,000) × 100% = 91.3%
Step 5: Calculate ongoing annual ROI = ($29,700 - $1,000) / $15,000 = 191.3%
Therefore, the first-year ROI is 91.3%, with ongoing annual ROIs of 191.3%.
This calculation shows how automation ROI changes over time. The first year includes the full implementation cost, reducing the ROI. Subsequent years exclude the initial investment, resulting in higher ROIs. This demonstrates why automation projects often become more valuable over time.
First-Year ROI: Return in the initial implementation year
Ongoing ROI: Return in subsequent operational years
Annual Maintenance: Recurring costs to keep automation running
• Include all implementation costs in initial investment
• Account for ongoing maintenance costs annually
• Calculate both first-year and ongoing ROIs
• Consider multi-year payback periods for large implementations
• Include productivity improvements beyond time savings
• Factor in error reduction and quality improvements
• Forgetting to include maintenance costs in ongoing calculations
• Not distinguishing between first-year and ongoing ROIs
• Overlooking intangible benefits in ROI calculations
Company A is considering two automation options. Option 1 costs $8,000 initially with $500 annual maintenance, saving 2 hours per day. Option 2 costs $12,000 initially with $300 annual maintenance, saving 3 hours per day. Both employees earn $40/hour and work 250 days per year. Which option provides the better ROI?
Option 1 Analysis:
Time saved annually = 2 hours/day × 250 days = 500 hours
Value of time saved = 500 hours × $40/hour = $20,000
First-year net benefit = $20,000 - $8,000 - $500 = $11,500
First-year ROI = ($11,500 / $8,000) × 100% = 143.75%
Option 2 Analysis:
Time saved annually = 3 hours/day × 250 days = 750 hours
Value of time saved = 750 hours × $40/hour = $30,000
First-year net benefit = $30,000 - $12,000 - $300 = $17,700
First-year ROI = ($17,700 / $12,000) × 100% = 147.5%
While Option 2 has a slightly higher ROI (147.5% vs 143.75%), it also provides greater absolute benefits ($17,700 vs $11,500 net benefit).
This comparison shows that higher ROI isn't always better when absolute benefits matter. Option 2 provides a slightly higher ROI but significantly greater net benefit. Decision-makers should consider both metrics: ROI for efficiency and absolute benefit for total value creation.
Comparative ROI: Comparing ROIs across different investment options
Absolute Benefit: Total financial gain regardless of investment size
Relative Benefit: Benefit per unit of investment
• Compare both ROI and absolute benefits
• Consider strategic alignment beyond pure ROI
• Account for all relevant costs and benefits
• Create decision matrices including ROI, payback period, and strategic fit
• Consider scalability and future expansion potential
• Factor in implementation complexity and risk
• Focusing only on ROI without considering absolute benefits
• Not accounting for all implementation costs
• Ignoring intangible benefits in comparative analysis
An automation project costs $24,000 to implement and saves $2,000 per month in labor costs. The project has ongoing monthly maintenance costs of $200. What is the break-even point in months? How does this change if monthly savings increase to $2,500?
Scenario 1 (Monthly savings = $2,000):
Net monthly savings = $2,000 - $200 = $1,800
Break-even point = $24,000 ÷ $1,800 = 13.33 months ≈ 14 months
Scenario 2 (Monthly savings = $2,500):
Net monthly savings = $2,500 - $200 = $2,300
Break-even point = $24,000 ÷ $2,300 = 10.43 months ≈ 11 months
Increasing monthly savings from $2,000 to $2,500 reduces the break-even point from 14 to 11 months, a 21% improvement.
Break-even analysis determines when cumulative benefits equal the initial investment. The formula is: Break-even = Initial Investment / (Monthly Savings - Monthly Costs). This analysis helps determine when an investment becomes profitable and supports decision-making about timing and funding.
Break-Even Point: When cumulative benefits equal initial investment
Net Monthly Savings: Gross savings minus ongoing costs
Payback Period: Time required to recover initial investment
• Break-even = Initial Investment / Net Monthly Benefit
• Include all recurring costs in calculations
• Shorter payback periods indicate lower risk
• Calculate break-even under different scenarios
• Consider the time value of money for longer-term projects
• Factor in risk tolerance when evaluating payback periods
• Forgetting to account for ongoing maintenance costs
• Not considering seasonal variations in savings
• Ignoring the impact of inflation on future savings
Which of the following is NOT typically considered when calculating automation ROI?
The answer is D) Stock price fluctuations. Stock price movements are influenced by numerous factors beyond automation projects and are not directly attributable to specific automation investments. While automation can positively impact stock prices indirectly, this is not a measurable direct benefit of automation.
When calculating ROI, we focus on measurable benefits that can be directly attributed to the automation project. Time savings, error reduction, and employee satisfaction are all tangible outcomes of automation. However, stock prices reflect market sentiment and are influenced by many factors beyond individual automation projects.
Tangible Benefits: Quantifiable financial impacts
Intangible Benefits: Hard-to-measure improvements
Attributable Benefits: Directly linked to automation
• Focus on benefits directly caused by automation
• Include both tangible and intangible benefits
• Avoid attributing unrelated market changes to automation
• Document both quantitative and qualitative improvements
• Use proxy metrics for intangible benefits
• Be conservative in attributing benefits to automation
• Attributing broad business improvements solely to automation
• Ignoring intangible benefits in ROI calculations
• Including unrelated market or economic changes
FAQ
Q: How do I account for intangible benefits in automation ROI calculations?
A: While the basic ROI formula focuses on tangible benefits, intangible benefits can be incorporated using proxy metrics. The core formula is: \( \text{ROI} = \frac{\text{Net Benefit}}{\text{Total Investment}} \times 100\% \).
For intangibles, assign monetary values where possible:
- Error reduction: Calculate cost of errors prevented
- Quality improvements: Estimate customer retention value
- Employee satisfaction: Factor in reduced turnover costs
- Compliance: Estimate audit and penalty avoidance
For example, if automation reduces errors by 90% and previous errors cost $5,000 annually, add this to the benefit calculation.
Q: What ROI threshold should I use to approve automation projects?
A: ROI thresholds vary by organization and industry, but here are general guidelines:
- Excellent ROI: 200%+ (saves investment in 6 months)
- Good ROI: 100-200% (pays back in 1 year)
- Acceptable ROI: 50-100% (pays back in 1-2 years)
- Threshold: Generally 50% minimum for most organizations
However, consider strategic importance beyond pure ROI. Critical processes or compliance requirements may justify lower ROIs. Also factor in scalability and future expansion potential.