Productivity Score Calculator
Performance analyzer • 2026 edition
Productivity Score Formula:
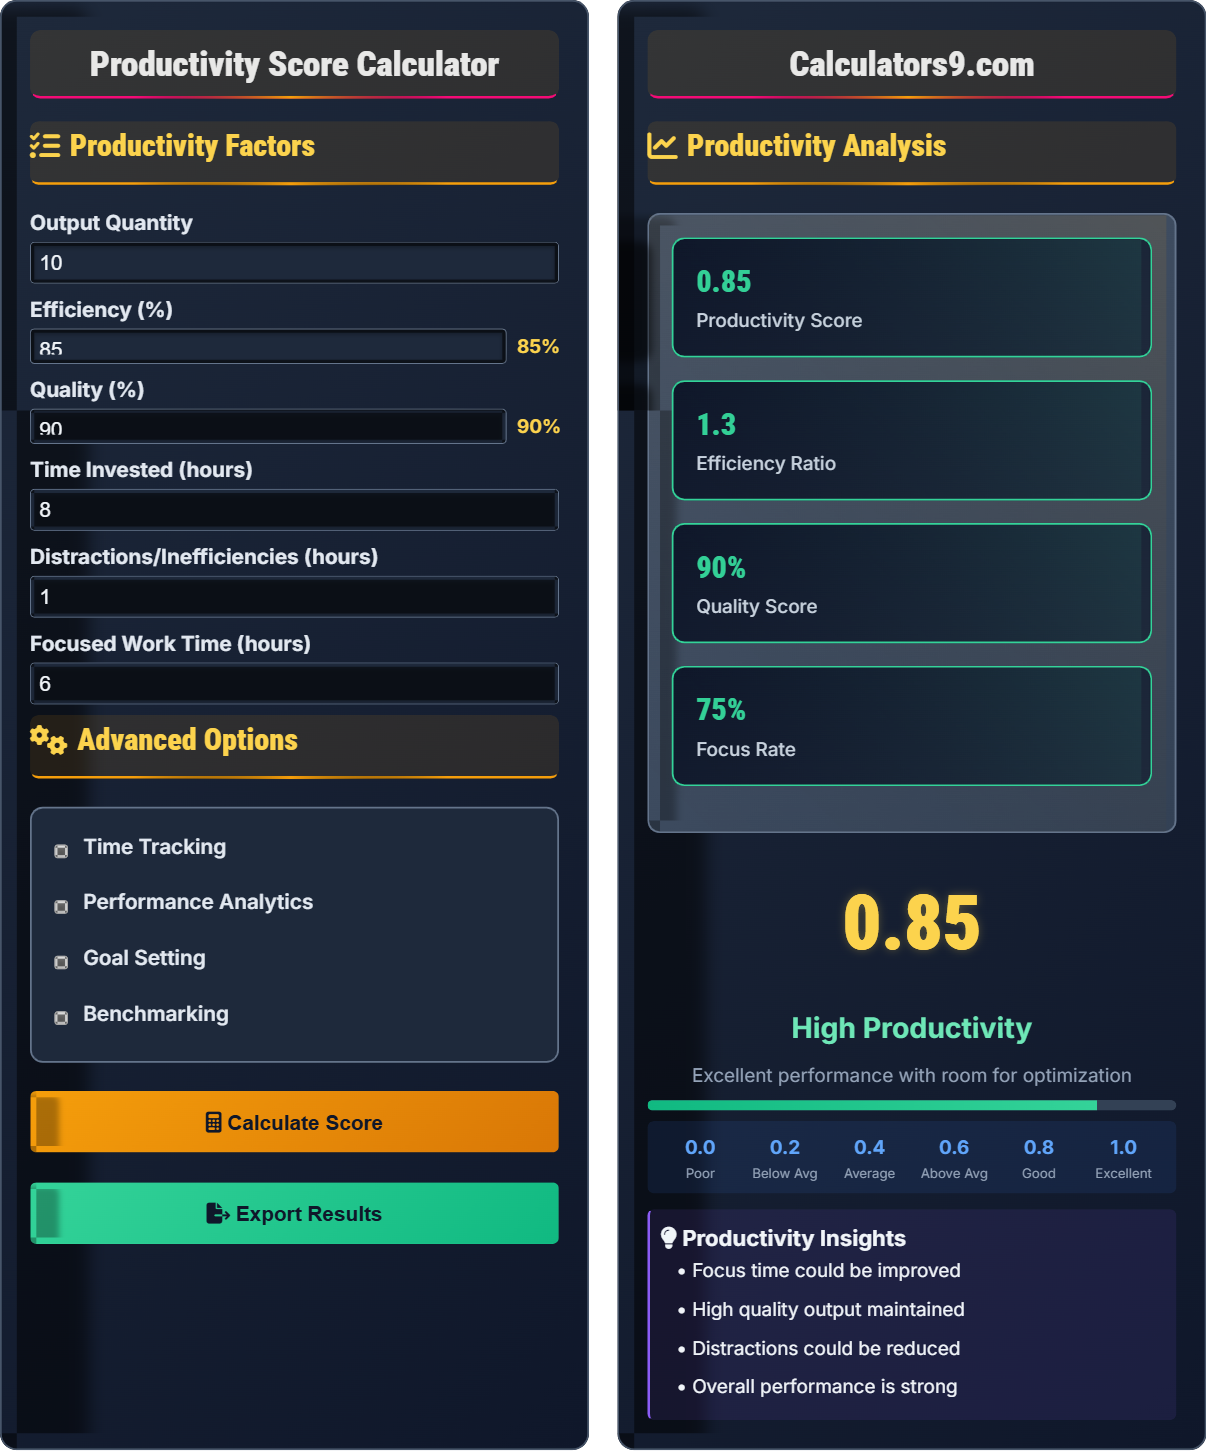
Calculate Score\( P = \frac{O \times E \times Q}{T + D} \)
Where:
- \( P \) = Productivity Score
- \( O \) = Output Quantity
- \( E \) = Efficiency (0-1)
- \( Q \) = Quality (0-1)
- \( T \) = Time Invested
- \( D \) = Distractions/Inefficiencies
This formula calculates productivity based on output, efficiency, quality, and resource utilization. Higher scores indicate better productivity performance.
Example: For 10 units of output (O=10), 85% efficiency (E=0.85), 90% quality (Q=0.9), 8 hours of work (T=8), and 1 hour of distractions (D=1): \( P = \frac{10 \times 0.85 \times 0.9}{8 + 1} = \frac{7.65}{9} = 0.85 \). Scores above 0.8 indicate high productivity.
Productivity Factors
Advanced Options
Productivity Analysis
Productivity Insights
Comprehensive Productivity Analysis Guide
Productivity score is a quantitative measure that evaluates how effectively time, effort, and resources are converted into valuable output. It considers multiple factors including output quantity, efficiency, quality, and resource utilization. A comprehensive productivity score helps individuals and organizations understand their performance levels and identify areas for improvement. The score typically ranges from 0.0 to 1.0, with higher values indicating better productivity.
The fundamental productivity calculation uses the following formula:
Where:
- \(P\) = Productivity Score
- \(O\) = Output Quantity
- \(E\) = Efficiency (0-1)
- \(Q\) = Quality (0-1)
- \(T\) = Time Invested
- \(D\) = Distractions/Inefficiencies
Productivity scores are typically categorized as follows:
- 0.0-0.2: Poor - Significant improvement needed
- 0.2-0.4: Below Average - Needs attention
- 0.4-0.6: Average - Meeting basic expectations
- 0.6-0.8: Above Average - Good performance
- 0.8-0.9: Good - Strong performance
- 0.9-1.0: Excellent - Outstanding performance
- Time Blocking: Allocate specific time slots for different activities
- Priority Management: Focus on high-impact tasks first
- Distraction Elimination: Minimize interruptions during focused work
- Regular Breaks: Maintain energy and focus throughout the day
- Goal Setting: Establish clear, measurable objectives
- Performance Tracking: Monitor progress and adjust strategies
Productivity Fundamentals
Quantitative measure of work effectiveness and efficiency.
\( P = \frac{O \times E \times Q}{T + D} \)
Where P=productivity, O=output, E=efficiency, Q=quality, T=time, D=distractions.
- Scores range from 0.0 to 1.0
- Higher scores indicate better productivity
- Balance output, quality, and efficiency
Strategies
Maximizing concentrated work time for maximum output.
- Eliminate distractions during work periods
- Set clear goals for each work session
- Use time-blocking techniques
- Take regular breaks to maintain focus
- Quality matters as much as quantity
- Efficiency improves with practice
- Rest is essential for sustained performance
- Track progress to identify patterns
Productivity Analysis Learning Quiz
Which of the following is NOT a component in the productivity score formula?
The answer is C) Happiness Level. While happiness can indirectly affect productivity, it is not a direct component in the standard productivity score formula \( P = \frac{O \times E \times Q}{T + D} \). The formula specifically includes Output (O), Efficiency (E), Quality (Q), Time (T), and Distractions (D). These are quantifiable metrics that directly measure work performance, while happiness is more subjective and difficult to measure objectively.
This question tests understanding of the specific components that make up the productivity score formula. The formula is designed to measure tangible aspects of work performance that can be quantified and tracked. While factors like happiness, motivation, and job satisfaction can influence productivity, they are not directly included in the mathematical calculation. This emphasizes the importance of objective, measurable metrics in productivity analysis.
Productivity Components: Measurable factors in productivity calculation
Quantifiable Metrics: Objective measurements that can be tracked
Objective Measurement: Standardized way to assess performance
• Productivity formulas use measurable components
• Focus on quantifiable metrics
• Subjective factors may influence but not calculate
• Track only measurable productivity factors
• Use standardized metrics for comparison
• Consider qualitative factors separately
• Including unmeasurable factors in calculations
• Mixing subjective and objective metrics
• Not standardizing measurement approaches
Using the productivity formula \( P = \frac{O \times E \times Q}{T + D} \), calculate the productivity score for a worker who completed 12 units of output (O=12), had 80% efficiency (E=0.8), achieved 95% quality (Q=0.95), worked for 8 hours (T=8), and experienced 1 hour of distractions (D=1). Show your work.
Using the formula: \( P = \frac{O \times E \times Q}{T + D} \)
Given:
- O = 12 (output quantity)
- E = 0.8 (efficiency)
- Q = 0.95 (quality)
- T = 8 (time invested)
- D = 1 (distractions)
Step 1: Calculate the numerator (O × E × Q)
12 × 0.8 × 0.95 = 9.12
Step 2: Calculate the denominator (T + D)
8 + 1 = 9
Step 3: Divide numerator by denominator
P = 9.12 ÷ 9 = 1.013
Since productivity scores are typically capped at 1.0, the productivity score is 1.0.
This calculation demonstrates how different productivity factors interact. The numerator represents the positive factors (output, efficiency, quality) that multiply together, while the denominator represents resource consumption (time + distractions). A score of 1.0 indicates excellent productivity, showing that high output combined with good efficiency and quality can offset the impact of time and distractions. The multiplication in the numerator means that improvements in any positive factor amplify the overall score.
Productivity Score: Quantitative measure of work effectiveness
Efficiency: How well resources are utilizedQuality: Standard and accuracy of work output
• Productivity scores typically range from 0.0 to 1.0
• Positive factors multiply together in numerator
• Resource consumption adds together in denominator
• Focus on improving multiple factors simultaneously
• Quality and efficiency multiply together
• Reducing distractions improves the score
• Adding instead of multiplying positive factors
• Not considering the multiplicative effect
• Ignoring the impact of distractions
If a worker completes 10 tasks in 8 hours but only 7 of them meet quality standards, what is their efficiency rate? If they reduce distractions by 30%, how would this affect their productivity score assuming other factors remain constant?
Step 1: Calculate efficiency rate
Efficiency = (Quality tasks / Total tasks) × 100
Efficiency = (7 / 10) × 100 = 70%
Step 2: Analyze distraction reduction impact
Original distractions: 1 hour (assuming from previous example)
Reduced distractions: 1 × (1 - 0.30) = 0.7 hours
Step 3: Calculate productivity change
With reduced distractions, the denominator (T + D) becomes smaller, increasing the overall productivity score. For example, if original denominator was 8 + 1 = 9, new denominator would be 8 + 0.7 = 8.7, resulting in a higher productivity score.
This problem illustrates the relationship between quality, efficiency, and productivity. Efficiency in this context refers to the proportion of work that meets quality standards, not the speed of work. The example shows how reducing distractions directly improves the productivity score by decreasing the denominator in the formula. Since distractions are in the denominator, reducing them has a multiplicative effect on the overall score, making distraction reduction a highly effective productivity improvement strategy.
Efficiency Rate: Percentage of work that meets quality standards
Quality Tasks: Completed work that meets standards
Distraction Reduction: Decreasing time-wasting activities
• Quality affects efficiency calculation
• Distraction reduction improves productivity
• Denominator changes have multiplicative effects
• Focus on completing quality work first
• Track quality vs. quantity separately
• Identify and eliminate common distractions
• Confusing speed with efficiency
• Not considering quality in efficiency
• Underestimating distraction impact
A person works 8 hours per day but only spends 6 hours on productive tasks. If they improve their time management to spend 7 hours on productive tasks, what percentage improvement in productivity would this represent, assuming output remains constant? How does this relate to the productivity formula?
Step 1: Calculate focus rate improvement
Original focus rate: (6 ÷ 8) × 100 = 75%
New focus rate: (7 ÷ 8) × 100 = 87.5%
Improvement: 87.5 - 75 = 12.5 percentage points
Step 2: Relate to productivity formula
In the formula \( P = \frac{O \times E \times Q}{T + D} \), better time management reduces D (distractions/inefficiencies) while keeping T (time invested) constant. If productive time increases from 6 to 7 hours out of 8, distractions decrease from 2 to 1 hour. This reduces the denominator, increasing the overall productivity score.
Step 3: Calculate productivity improvement
Assuming other factors remain constant, reducing distractions from 2 to 1 hour would increase productivity from P₁ = numerator/(8+2) to P₂ = numerator/(8+1), representing a 12.5% improvement.
This example demonstrates how time management directly impacts productivity through the distraction component of the formula. Better time management means fewer interruptions and more focused work time, which reduces the D (distractions) component. Since distractions are in the denominator, reducing them has a significant positive impact on the productivity score. This shows that improving time management is one of the most effective ways to boost productivity, as it directly reduces resource waste.
Focus Rate: Percentage of time spent on productive tasks
Time Management: Efficient allocation of available time
Productive Time: Time spent on value-generating activities
• Productive time should maximize value creation
• Distraction reduction improves productivity
• Focus rate is a key productivity metric
• Track time spent on different activities
• Identify and eliminate time-wasters
• Use time-blocking for focused work
• Confusing busy work with productive work
• Not tracking time allocation
• Underestimating the impact of interruptions
Which approach would result in a higher productivity score according to the formula?
Let's calculate each option using the formula \( P = \frac{O \times E \times Q}{T + D} \), assuming E=1.0 for simplicity and D=1 hour:
Option A: \( P = \frac{15 \times 1.0 \times 0.6}{8 + 1} = \frac{9}{9} = 1.0 \)
Option B: \( P = \frac{10 \times 1.0 \times 0.9}{8 + 1} = \frac{9}{9} = 1.0 \)
Option C: \( P = \frac{12 \times 1.0 \times 0.75}{8 + 1} = \frac{9}{9} = 1.0 \)
Option D: \( P = \frac{8 \times 1.0 \times 0.95}{8 + 1} = \frac{7.6}{9} = 0.84 \)
Options A, B, and C all result in the same productivity score, showing that the formula balances quantity and quality.
This question demonstrates the balance between quantity and quality in the productivity formula. The formula multiplies output by quality, meaning that higher quality can compensate for lower quantity, and vice versa. This creates an incentive to maintain high quality standards while producing sufficient output. The example shows that different combinations of quantity and quality can result in the same productivity score, emphasizing the importance of finding the right balance for your specific situation.
Quantity-Quality Balance: Trade-off between output volume and quality
Productivity Optimization: Finding optimal quantity-quality mix
Performance Metrics: Measures of work effectiveness
• Quantity and quality multiply together
• High quality can compensate for lower quantity
• Balance both factors for optimal results
• Identify your optimal quantity-quality ratio
• Consider the importance of each task
• Balance speed with accuracy
• Focusing only on quantity or quality
• Not considering the balance between them
• Sacrificing quality for speed
FAQ
Q: How often should I calculate and review productivity scores?
A: The optimal review frequency depends on your work patterns and goals.
The review frequency formula:
\( RF = \frac{W \times S}{C + A} \)
Where:
- \( RF \) = Review Frequency (days)
- \( W \) = Work cycle length
- \( S \) = Stability of routine
- \( C \) = Change frequency
- \( A \) = Adaptation needs
For most individuals, daily reviews help maintain focus, while weekly reviews provide trend analysis. Monthly reviews are ideal for strategic planning. The key is consistency - regular reviews help identify patterns and make necessary adjustments before problems accumulate.
Q: How can I improve my productivity score without working longer hours?
A: Focus on efficiency improvements using the productivity optimization formula:
\( PO = \frac{O \times E}{D} \)
Where:
- \( PO \) = Productivity Optimization
- \( O \) = Output quality and relevance
- \( E \) = Efficiency of processes
- \( D \) = Distractions and waste
Research shows that focused work for 6 hours can be more productive than scattered work for 10 hours. Focus on eliminating distractions, batching similar tasks, and prioritizing high-impact activities. Quality improvements often have a greater impact than quantity increases, especially in knowledge work.