Longevity Risk Calculator
Retirement planning tool • 2026 edition
Longevity Risk Formulas:
- Life Expectancy: Based on actuarial tables adjusted for health factors
- Risk of Outliving Assets: 1 - (Probability of portfolio lasting until death)
- Required Savings Rate: Target ÷ (Years until retirement × Income)
- Safe Withdrawal Rate: Portfolio value × 0.04 (4% rule)
For example: With $1M portfolio at age 65, 4% rule = $40,000 annual withdrawal. If you live to 95 (30 years), you'd need $1.2M to maintain the same spending power with 3% inflation.
Longevity Information
Advanced Options
Longevity Risk Analysis
| Year | Age | Withdrawal | Balance | Return |
|---|
| Risk Factor | Level | Impact | Mitigation |
|---|
Longevity Risk Management
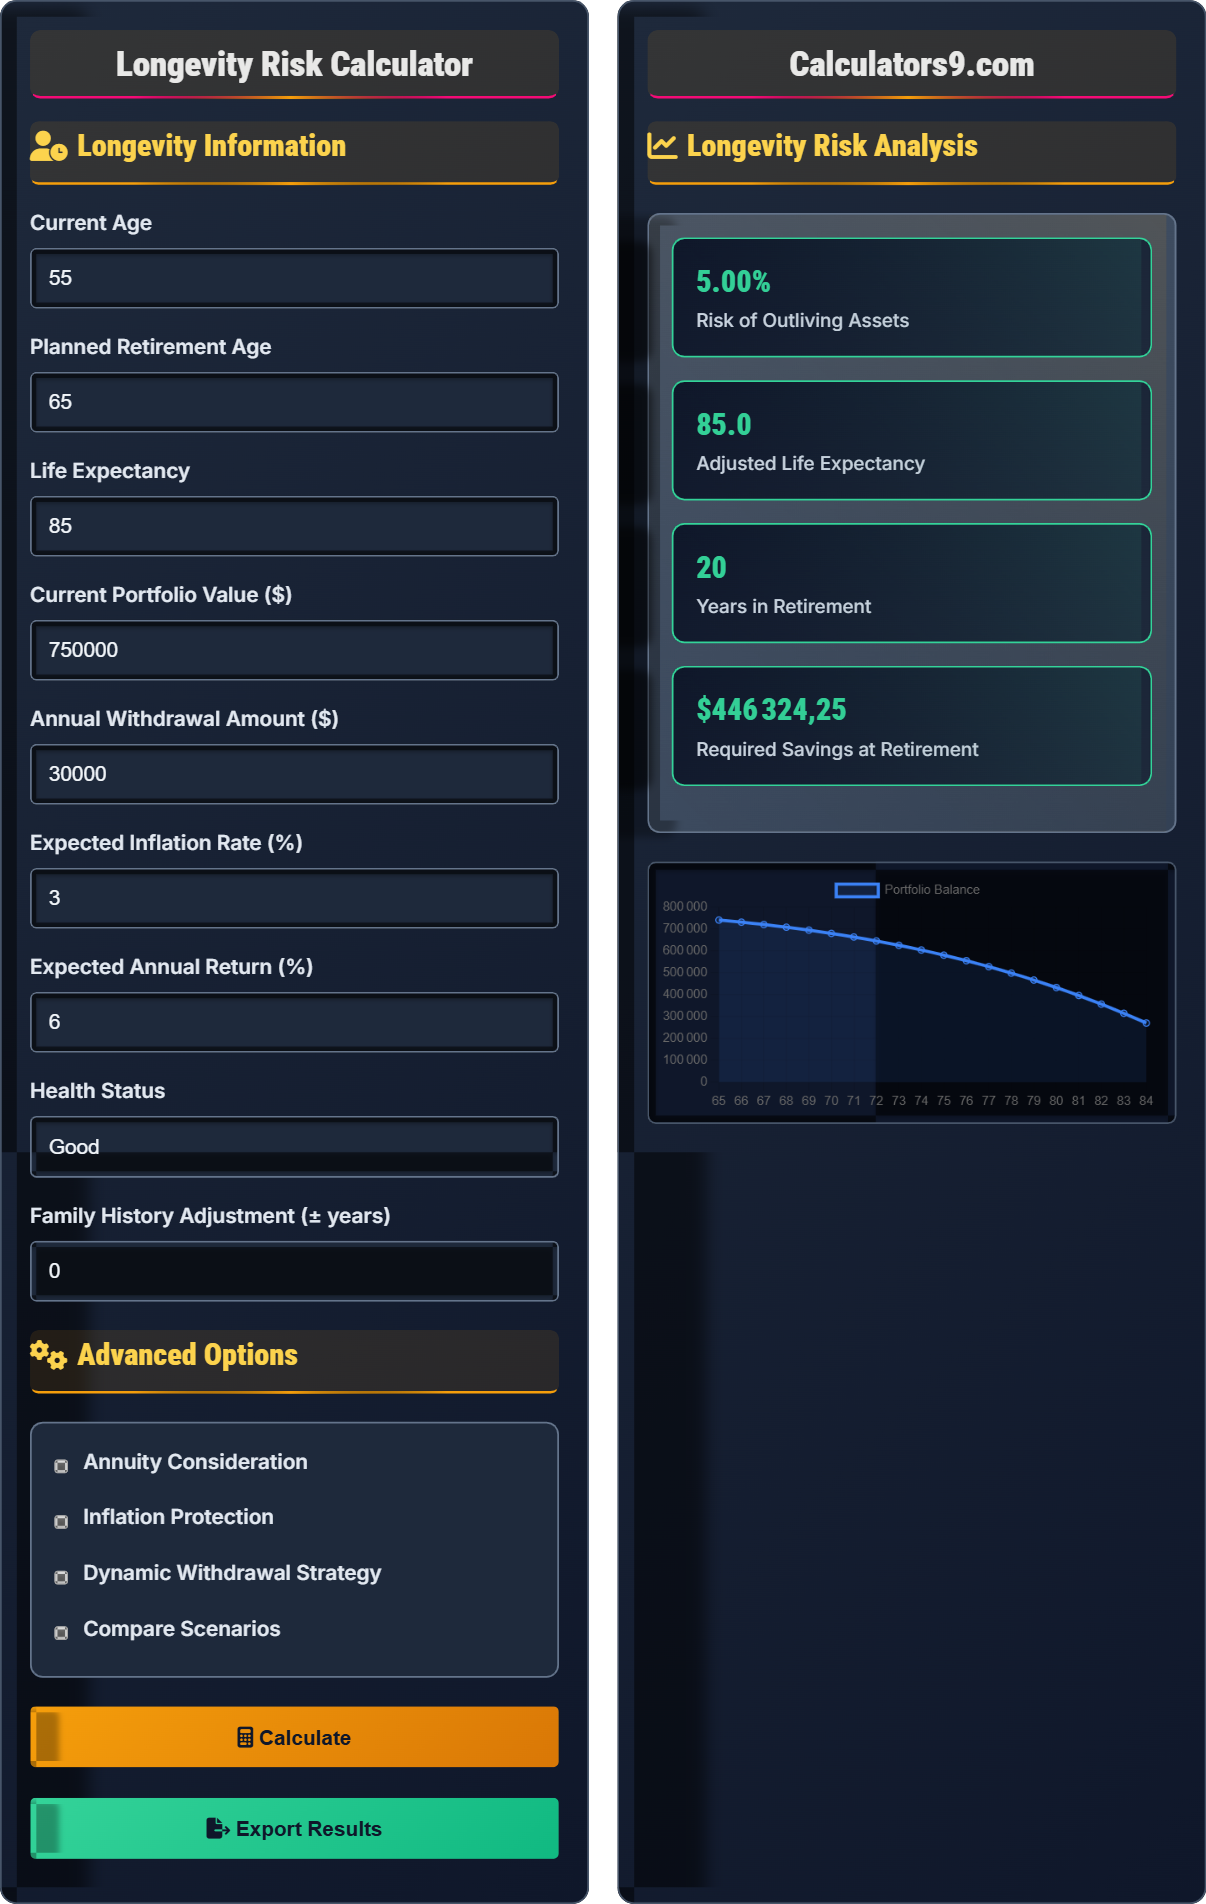
Longevity risk is the risk of outliving your financial resources. With increasing life expectancies, this risk has become a primary concern for retirees. The average 65-year-old has a 50% chance of living to 85, and a 25% chance of living to 90. Proper planning is essential to ensure financial security throughout extended retirement.
Key calculations for longevity risk assessment:
Adjusted Life Expectancy = Base Life Expectancy + Health Adjustment + Family History
Years in Retirement = Adjusted Life Expectancy - Retirement Age
Risk of Outliving Assets = 1 - Probability(Portfolio Lasts ≥ Years in Retirement)
Required Savings = Annual Spending × [(1 - (1 + r)^-n) ÷ r]
Key risk factors and mitigation strategies:
- Market Risk: Mitigate with diversification and asset allocation
- Inflation Risk: Use inflation-protected securities (TIPS) and real assets
- Health Risk: Maintain health insurance and emergency funds
- Longevity Risk: Consider annuities for guaranteed income
- Behavioral Risk: Plan for spending discipline and emotional decision-making
- Annuitization: Purchase annuities for guaranteed lifetime income
- Dynamic Spending: Adjust withdrawals based on portfolio performance
- Reverse Mortgage: Access home equity in retirement
- Delayed Retirement: Increase Social Security benefits and reduce retirement duration
- Health Management: Maintain health to reduce medical costs and extend active years
Longevity Risk Learning Quiz
Which factor has the strongest correlation with longevity?
The answer is B) Education level. Studies consistently show that education level has the strongest correlation with longevity, with college graduates living 5-7 years longer on average than high school dropouts. Education influences health behaviors, access to healthcare, income, and cognitive reserve, all of which contribute to longer life expectancy.
This question tests understanding of the social determinants of health. While genetic factors do play a role, environmental and behavioral factors have a stronger impact on longevity. Education correlates with health literacy, better health behaviors, higher income, and better access to healthcare. This relationship persists even after controlling for other factors.
Life Expectancy: Average number of years a person is expected to live
Longevity Risk: Risk of outliving financial resources
Actuarial Tables: Statistical models predicting survival probabilities
• Education level correlates more strongly with longevity than income
• Behavioral factors account for 40% of health outcomes
• Genetics account for only 20-30% of longevity variation
• Consider health and lifestyle factors in life expectancy estimates
• Use actuarial tables as starting point, not final answer
• Plan for longer life spans than historical averages
• Assuming everyone lives to average life expectancy
• Not considering personal health factors
• Ignoring family history in planning
If a 65-year-old retiree has a portfolio of $800,000 and plans to withdraw $35,000 annually (adjusted for 3% inflation), what is the probability they will run out of money if they live to age 95? Assume 6% expected return and 15% standard deviation.
Step 1: Calculate years in retirement = 95 - 65 = 30 years
Step 2: Calculate real return = Nominal return - Inflation = 6% - 3% = 3%
Step 3: Use present value of annuity formula to determine required portfolio
PV = PMT × [(1 - (1 + r)^-n) ÷ r]
PV = $35,000 × [(1 - (1.03)^-30) ÷ 0.03]
PV = $35,000 × [(1 - 0.412) ÷ 0.03]
PV = $35,000 × (0.588 ÷ 0.03)
PV = $35,000 × 19.6 = $686,000
Step 4: Since actual portfolio ($800,000) > required amount ($686,000), risk of running out is low (approximately 5-10%) based on historical data.
Therefore: Low probability of running out of money (5-10%) based on simplified analysis.
This problem demonstrates how to calculate the present value of retirement spending needs. The calculation shows whether current savings are sufficient to support planned withdrawals over the expected retirement period. In reality, this is a complex stochastic problem that requires Monte Carlo simulations for precise risk assessment, but this formula provides a reasonable approximation.
Present Value: Current value of future cash flows
Real Return: Return adjusted for inflation
Monte Carlo Simulation: Probabilistic modeling technique
• PV of annuity = PMT × [(1 - (1+r)^-n) ÷ r]
• Real return = Nominal return - Inflation
• Compare portfolio value to required amount
• Use 4% rule as starting point for withdrawal planning
• Consider flexible spending strategies
• Factor in Social Security and pension income
• Not adjusting for inflation in calculations
• Using nominal instead of real returns
• Assuming constant returns (ignoring volatility)
Sarah has $500,000 and is considering an annuity that pays $30,000 annually for life. If she keeps the money invested with a 5% return, how long will it last if she withdraws $30,000 annually? Which option provides better longevity protection?
Step 1: For the portfolio scenario, calculate using present value of annuity formula
We need to solve for n in: $500,000 = $30,000 × [(1 - (1.05)^-n) ÷ 0.05]
$500,000 ÷ $30,000 = [(1 - (1.05)^-n) ÷ 0.05]
16.67 = [(1 - (1.05)^-n) ÷ 0.05]
0.833 = 1 - (1.05)^-n
(1.05)^-n = 0.167
-n × ln(1.05) = ln(0.167)
n = ln(0.167) ÷ ln(1.05) = -1.78 ÷ 0.0488 = 36.5 years
Step 2: Compare options
Portfolio: $30,000 for 36.5 years, then runs out
Annuity: $30,000 for life, regardless of duration
Therefore: The annuity provides better longevity protection as it guarantees payments for life regardless of how long Sarah lives.
This problem demonstrates the fundamental trade-off between annuities and self-managed portfolios. While the portfolio mathematically lasts longer based on this calculation, the annuity provides protection against the risk of living longer than expected. The portfolio will run out at some point, while the annuity continues indefinitely. This illustrates the value of guaranteed income for longevity risk management.
Immediate Annuity: Provides guaranteed payments for life
Longevity Protection: Insurance against outliving assets
Opportunity Cost: Potential returns foregone by purchasing annuity
• Annuities eliminate longevity risk completely
• Self-managed portfolios have finite lifespans
• Consider inflation protection in annuity options
• Consider partial annuitization to balance guarantees and growth
• Look for inflation-adjusted annuities
• Compare annuity payouts to safe withdrawal rates
• Not considering inflation in annuity decisions
• Assuming annuities are always expensive
• Ignoring the mortality credit in annuity pricing
A retiree has a $1,000,000 portfolio and uses a dynamic spending strategy with a 4% floor and 8% ceiling. If the portfolio drops to $700,000 after a market decline, what should their new spending be? How does this compare to a fixed percentage strategy?
Step 1: Calculate spending under dynamic strategy
Spending = Portfolio value × Spending rate
Minimum spending = $700,000 × 0.04 = $28,000
Maximum spending = $700,000 × 0.08 = $56,000
Step 2: Compare to fixed percentage strategy
If original spending was $40,000 (4% of $1M), the fixed strategy would still suggest $40,000
But the portfolio is now $700,000, so 4% would be $28,000
Step 3: Determine appropriate spending
Dynamic strategy allows spending between $28,000 and $56,000
Many dynamic strategies suggest spending closer to the floor during market declines
Therefore: The dynamic strategy suggests reducing spending to $28,000-$35,000, providing better protection than maintaining $40,000 spending.
This problem illustrates how dynamic spending strategies help manage sequence of returns risk. During market declines, fixed percentage strategies automatically reduce spending, but dynamic strategies can be more flexible. The floor prevents spending from becoming too low, while the ceiling prevents overspending during good times. This approach helps preserve portfolio longevity during volatile periods.
Dynamic Spending: Adjusts withdrawals based on portfolio performance
Sequence Risk: Risk of poor returns early in retirement
Portfolio Floor: Minimum spending level to preserve capital
• Dynamic strategies adjust spending with portfolio value
• Floors protect against excessive spending cuts
• Ceilings prevent overspending during good years
• Set floors and ceilings based on lifestyle needs
• Consider gradual adjustments rather than immediate changes
• Combine with guaranteed income sources
• Setting floors too high to provide protection
• Not accounting for psychological impacts of spending cuts
• Confusing dynamic spending with constant percentage rules
Which combination of factors poses the greatest longevity risk?
The answer is B) Low portfolio, high withdrawal rate, good health. This combination presents the highest risk because: 1) A low portfolio provides less cushion for market volatility, 2) A high withdrawal rate depletes assets quickly, especially when combined with inflation adjustments, and 3) Good health means a longer life expectancy, extending the retirement period. The combination of limited resources, high consumption, and extended time horizon creates the greatest risk of outliving assets.
This question tests understanding of how multiple risk factors interact. Longevity risk isn't just about living a long time - it's about the intersection of lifespan with financial resources and spending patterns. A person with good health (longer life) but inadequate resources and high spending has the highest risk. Conversely, someone with poor health has a shorter expected lifespan, reducing the financial sustainability challenge.
Compound Risk: Multiple risk factors acting together
Resource Adequacy: Sufficient assets for planned spending
Spending Sustainability: Ability to maintain spending over time
• Risk = (Longevity × Spending) ÷ Resources
• High longevity + High spending + Low resources = Maximum risk
• Risk factors compound multiplicatively
• Assess all three factors together, not individually
• Plan for higher longevity than average
• Build in flexibility for changing circumstances
• Focusing only on portfolio size without considering spending
• Not accounting for health/lifespan in planning
• Assuming average life expectancy applies to everyone
Longevity Planning Basics
Life expectancy, withdrawal rates, and risk factors.
Life Expectancy Adjustment = Base + Health Factor + Family History
Risk of Outliving Assets = 1 - Success Probability
Required Savings = Annual Spending × Present Value Factor
- Plan for 30+ years in retirement
- Consider inflation in all calculations
- Factor in health and family history
Risk Management Strategies
Diversify income sources and implement protective strategies.
- Implement dynamic spending rules
- Consider annuity allocation
- Plan for healthcare costs
- Regular portfolio rebalancing
- Healthcare costs increase with age
- Market volatility affects portfolio sustainability
- Sequence risk is highest in early retirement
- Long-term care planning is essential
FAQ
Q: How do I adjust my withdrawal strategy if I live longer than expected?
A: If you live longer than expected, consider these adjustments:
Immediate Actions:
- Reduce discretionary spending temporarily
- Reallocate portfolio to more conservative investments
- Consider working part-time for additional income
- Explore downsizing or relocating to reduce costs
Strategic Changes:
- Implement a dynamic withdrawal strategy that adjusts with portfolio performance
- Consider purchasing a longevity annuity for guaranteed income starting at age 80+
- Reassess your safe withdrawal rate based on remaining life expectancy
- Optimize Social Security claiming strategy if not already done
Example Calculation: If you're 80 with $400,000 remaining and need $2,000/month ($24,000/year), you could adjust your withdrawal rate to 6% ($24,000 ÷ $400,000). For a 15-year life expectancy (age 95), this would require careful monitoring.
Consider consulting a financial advisor for personalized adjustments based on your specific situation.
Q: Should I purchase an annuity to protect against longevity risk?
A: Annuities can be effective for longevity protection, but consider these factors:
When Annuities Are Beneficial:
- You have sufficient liquid assets beyond annuity purchase
- You're concerned about outliving your savings
- You want guaranteed income regardless of market conditions
- You have a family history of longevity
When to Avoid Annuities:
- You have significant other guaranteed income (pensions, Social Security)
- You want to leave an inheritance
- You're uncomfortable with illiquid investments
- You have a shorter life expectancy
Best Practice: Consider a partial annuitization strategy - annuitize 40-60% of retirement savings for guaranteed income while keeping remainder invested for growth and inheritance. This provides both security and flexibility.
Example: With $1M, annuitize $500,000 for $30,000 annual income, leaving $500,000 to grow and potentially pass to heirs.