CTR Estimator
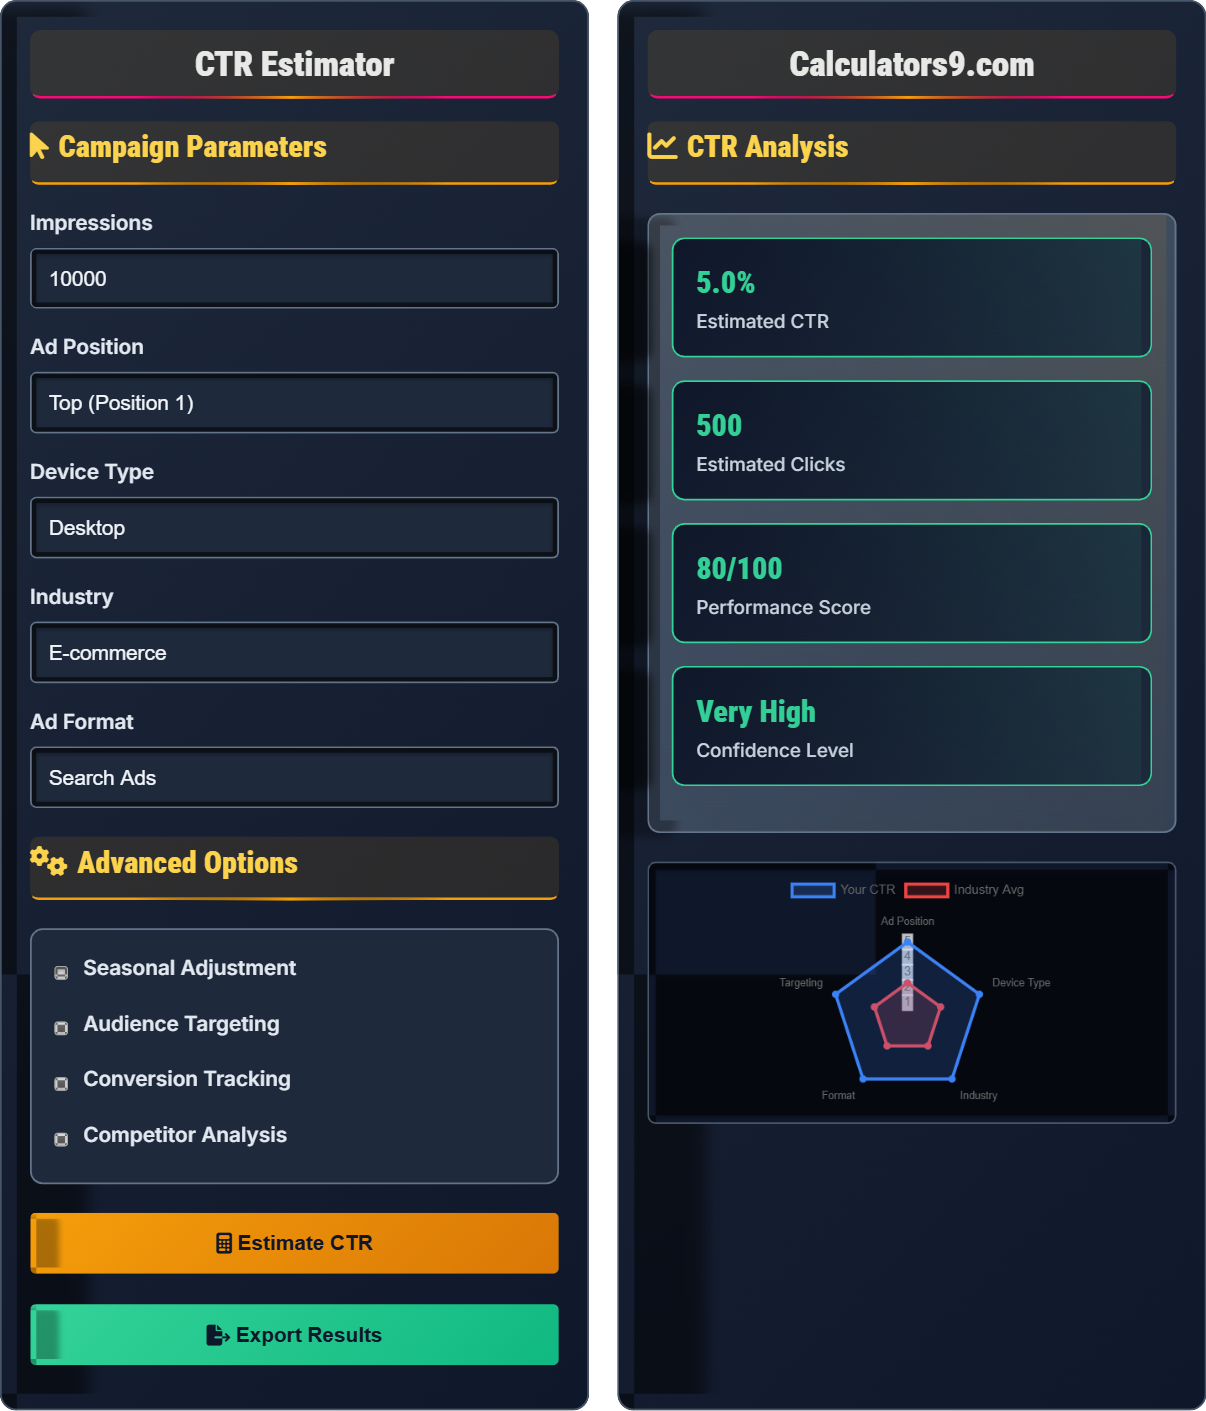
Click-through rate calculator • 2026 digital marketing
Campaign Parameters
Advanced Options
CTR Analysis
| Metric | Value | Industry Avg |
|---|---|---|
| CTR | 2.4% | 2.1% |
| Clicks | 240 | 210 |
| Impressions | 10,000 | 10,000 |
| Conversion Rate | 3.2% | 2.8% |
| Recommendation | Potential Impact | Priority |
|---|---|---|
| Improve Ad Copy | 15-25% CTR Increase | High |
| Optimize Landing Page | 10-15% Conversion Boost | Medium |
| Adjust Bid Strategy | 5-10% Position Improvement | Medium |
| Refine Audience Targeting | 20-30% CTR Improvement | High |
Comprehensive CTR Optimization Guide
Click-Through Rate (CTR) measures the percentage of people who click on your ad after seeing it. The formula is: CTR = (Clicks / Impressions) × 100. CTR is a critical metric that indicates how compelling your ads are to your target audience. Higher CTRs typically indicate more relevant and engaging ad content, which can lead to lower costs and better ad positioning.
The fundamental CTR formula is:
For example, if your ad received 1,000 impressions and 25 clicks: (25 / 1,000) × 100 = 2.5% CTR.
Average CTRs by industry and platform:
- Google Ads: 3.17% (Search), 0.59% (Display)
- Facebook Ads: 1.91% (News Feed), 0.90% (Right Column)
- LinkedIn Ads: 0.65% (Sponsored Content)
- YouTube Ads: 0.06% (Display), 1.84% (TrueView)
- Compelling Headlines: Use action words and value propositions
- Strong Call-to-Actions: Clear, actionable language
- Visual Appeal: High-quality images and videos
- Audience Targeting: Precise demographic and behavioral targeting
- Testing & Optimization: Regular A/B testing of ad elements
CTR Analysis Learning Quiz
If an ad campaign generates 15,000 impressions and receives 375 clicks, what is the CTR?
Using the formula: CTR = (Clicks / Impressions) × 100
Given:
- Clicks = 375
- Impressions = 15,000
Calculation: (375 / 15,000) × 100 = 0.025 × 100 = 2.5%
This problem demonstrates the fundamental CTR calculation. The formula takes the number of clicks (actual user actions) and divides by the number of impressions (times the ad was shown), then multiplies by 100 to convert to a percentage. This metric helps advertisers understand how effective their ads are at capturing attention and encouraging engagement. A 2.5% CTR is above average for most platforms.
Impression: One instance of an ad being displayed
Click: One instance of a user clicking on an ad
CTR: Click-Through Rate, percentage of impressions that result in clicks
• CTR = (Clicks / Impressions) × 100
• Higher CTRs indicate more engaging ads
• CTRs vary significantly by platform and industry
• Remember: (clicks ÷ impressions) × 100
• Always express CTR as a percentage
• Compare to industry benchmarks for context
• Dividing impressions by clicks instead of clicks by impressions
• Forgetting to multiply by 100 for percentage
• Not considering platform-specific benchmarks
A Google Ads campaign has a CTR of 4.2% while the industry average is 3.17%. Calculate the percentage improvement over average and explain the significance.
Percentage improvement: ((4.2 - 3.17) / 3.17) × 100 = (1.03 / 3.17) × 100 = 32.5%
The campaign performs 32.5% better than the industry average. This indicates strong ad relevance, effective targeting, and compelling ad copy. Higher-than-average CTRs typically result in lower costs per click and better ad positioning due to improved Quality Scores.
This example shows how to evaluate CTR performance against benchmarks. The calculation ((Your CTR - Average CTR) / Average CTR) × 100 gives the percentage difference. A 32.5% improvement over average is exceptional performance. In Google Ads, higher CTRs contribute to better Quality Scores, which can lead to lower costs and better ad positions, creating a positive feedback loop.
Quality Score: Google's rating of ad relevance and landing page quality
Industry Benchmark: Standard performance metrics for comparison
Cost Per Click (CPC): Amount paid for each ad click
• Compare CTRs to relevant benchmarks
• Higher CTRs often mean lower CPCs
• Context matters: search vs. display have different averages
• Use platform-specific benchmarks
• Consider industry variations
• Track trends over time
• Comparing search CTRs to display benchmarks
• Not considering seasonal variations
• Focusing solely on CTR without conversion metrics
A company's display ad campaign has 50,000 impressions and 250 clicks (0.5% CTR). They want to achieve a 1.2% CTR. Calculate how many additional clicks they need and discuss the feasibility of this goal.
Target clicks for 1.2% CTR: (1.2 × 50,000) / 100 = 600 clicks
Current clicks: 250
Additional clicks needed: 600 - 250 = 350 clicks
This represents a 140% increase in clicks. While challenging, this could be achieved through improved ad creative, better targeting, or enhanced call-to-actions. The 1.2% target is realistic for display ads (above average of 0.59%).
This problem demonstrates goal-setting in CTR optimization. Working backwards from a target CTR helps determine required performance improvements. A 140% increase is significant but achievable through systematic optimization. The calculation shows that reaching 1.2% CTR requires 600 clicks with 50,000 impressions. This exceeds the industry average, making it a stretch but attainable goal.
Display Advertising: Visual ads placed on websites
Ad Creative: Visual and text elements of an advertisement
Targeting: Selecting specific audiences for ad delivery
• Set realistic but ambitious CTR goals
• Consider industry benchmarks in goal setting
• Balance CTR with conversion quality
• A/B test ad variations systematically
• Improve targeting to reach interested users
• Use compelling visuals and clear CTAs
• Setting unrealistic CTR goals
• Chasing CTR without considering conversions
• Not testing multiple optimization strategies
A company runs campaigns across three platforms: Google (2.8% CTR, 100K impressions), Facebook (1.5% CTR, 80K impressions), and LinkedIn (0.8% CTR, 50K impressions). Calculate total clicks and overall CTR, then identify the most efficient platform.
Google clicks: (2.8 × 100,000) / 100 = 2,800 clicks
Facebook clicks: (1.5 × 80,000) / 100 = 1,200 clicks
LinkedIn clicks: (0.8 × 50,000) / 100 = 400 clicks
Total clicks: 2,800 + 1,200 + 400 = 4,400 clicks
Total impressions: 100,000 + 80,000 + 50,000 = 230,000 impressions
Overall CTR: (4,400 / 230,000) × 100 = 1.91%
Google has the highest CTR (2.8%) and generates the most clicks (2,800).
This example demonstrates cross-platform CTR analysis. Each platform has different average CTRs due to format, audience, and intent differences. Google typically has higher CTRs because users actively search for products/services. Facebook reaches users browsing passively. LinkedIn targets professionals. Understanding these differences helps optimize budget allocation across platforms based on performance and business objectives.
Multi-Platform Strategy: Running campaigns across multiple advertising channels
Channel Attribution: Assigning value to different marketing channels
Media Mix: Distribution of advertising spend across channels
• Different platforms have different CTR benchmarks
• Consider user intent when comparing platforms
• Evaluate CTR alongside conversion metrics
• Allocate more budget to higher-performing platforms
• Optimize creative for each platform's format
• Track conversions by platform, not just clicks
• Comparing CTRs across incompatible platforms
• Not considering different user intents by platform
• Focusing only on CTR without conversion analysis
Which of the following is the most effective strategy for improving CTR?
The answer is B) Improve ad relevance and create compelling copy. High-quality, relevant ads that resonate with user intent consistently achieve better CTRs. While ad position matters, the most important factor is whether the ad speaks to the user's needs and interests. Relevant ads also receive better Quality Scores, leading to lower costs and better positioning.
This question highlights the importance of ad quality over technical factors. While bid management and keyword expansion are important, the core of CTR improvement lies in creating ads that genuinely connect with the target audience. Relevant, compelling ad copy addresses user pain points and offers clear value propositions. This approach creates sustainable CTR improvements that benefit both performance and cost efficiency.
Ad Relevance: How closely ad matches user search/query intent
Quality Score: Platform's assessment of ad quality and relevance
User Intent: Purpose behind user's search or browsing activity
• Quality matters more than quantity in ad creation
• Match ad content to user search intent
• Test different messaging approaches
• Use emotional triggers in headlines
• Include relevant keywords in ad text
• Test different call-to-action phrases
• Focusing on technical optimization over creative quality
• Using generic messaging that doesn't resonate
• Not testing ad variations regularly
CTR Fundamentals
Percentage of impressions that result in clicks. Formula: (Clicks / Impressions) × 100.
Google Ads: 3.17% (Search), 0.59% (Display). Facebook: 1.91%. LinkedIn: 0.65%.
- Higher CTRs typically mean lower costs
- Context matters: compare to platform benchmarks
- Quality over quantity in optimization efforts
Optimization
Ad position, relevance, creative quality, and targeting all influence CTR.
- Enhance ad copy relevance
- Improve visual elements
- Refine audience targeting
- Test different call-to-actions
- Balance CTR with conversion quality
- Consider user journey stage
- Test systematically with A/B tests
- Monitor seasonal variations
FAQ
Q: What's a good CTR for 2026?
A: For search ads: 3-5% is excellent. Display ads: 1-2% is good. Social media: 1-3% varies by platform. Always compare to your industry benchmarks for accurate evaluation.
Q: Does higher CTR always mean better performance?
A: Not necessarily. High CTR with poor conversions can be costly. Focus on CTR combined with conversion rate and cost per acquisition. Quality of clicks matters more than quantity.