Social Media ROI Calculator
ROI analysis tool • 2026 digital marketing
Campaign Investment
Revenue Generation
Advanced Options
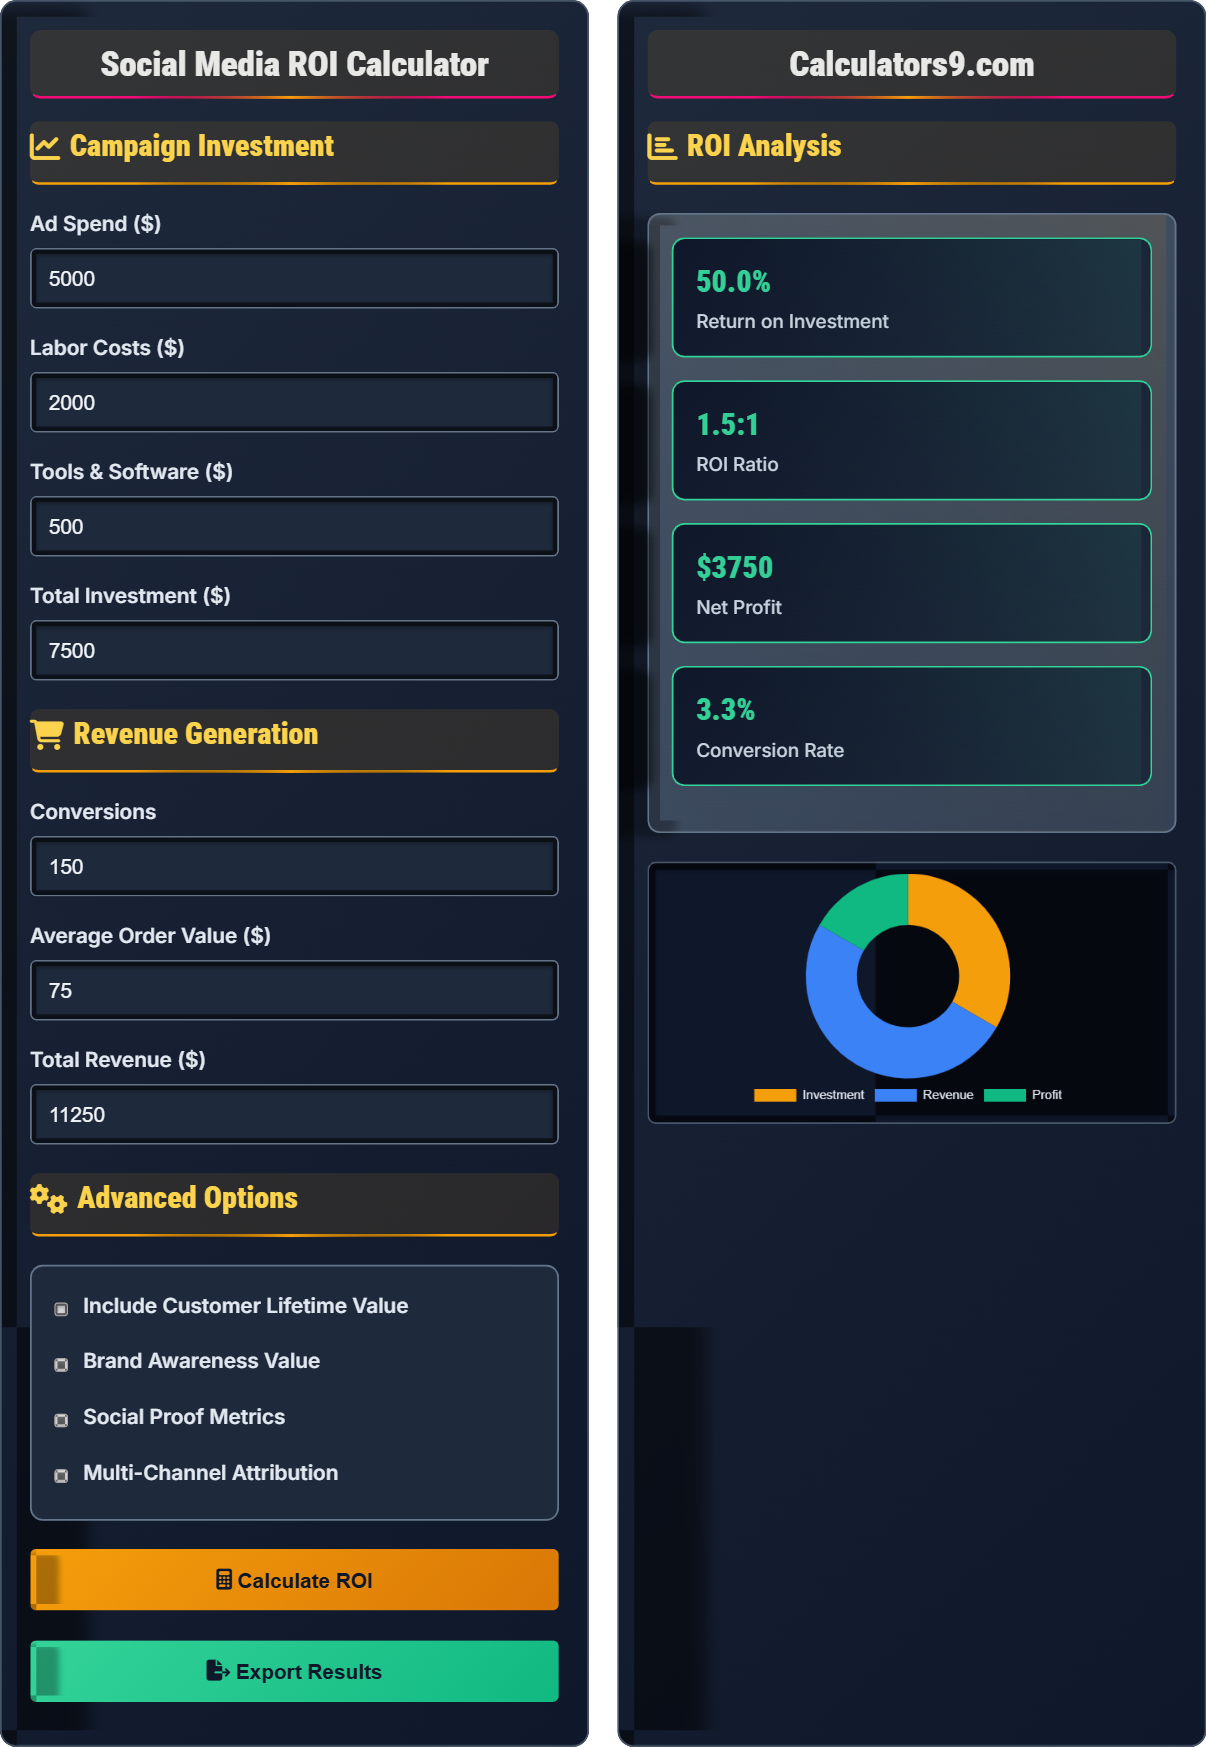
ROI Analysis
| Category | Amount | Percentage |
|---|---|---|
| Total Investment | $7,500 | 100% |
| Total Revenue | $11,250 | 150% |
| Net Profit | $3,750 | 50% |
| ROI | 50.0% | - |
| Metrics | Value | Industry Avg |
|---|---|---|
| Conversion Rate | 3.2% | 2.35% |
| Cost Per Conversion | $50.00 | $65.00 |
| Click-Through Rate | 2.8% | 1.9% |
| Engagement Rate | 4.1% | 3.2% |
Social Media ROI Learning Quiz
If a social media campaign costs $2,000 and generates $8,000 in revenue, what is the ROI?
Using the formula: ROI = (Revenue - Investment) / Investment × 100
Given:
- Investment = $2,000
- Revenue = $8,000
Calculation: ($8,000 - $2,000) / $2,000 × 100 = $6,000 / $2,000 × 100 = 300%
This problem demonstrates the fundamental ROI calculation. The formula subtracts the investment from the revenue to find the profit, then divides by the investment to find the return rate, and multiplies by 100 to convert to a percentage. A 300% ROI means for every dollar invested, $3 was returned in profit, plus the original investment back.
ROI: Return on Investment, profitability measure
Investment: Total costs associated with the campaign
Revenue: Total income generated from the campaign
• ROI = (Revenue - Investment) / Investment × 100
• ROI measures profitability, not just revenue
• Include all relevant costs in investment
• Remember: (revenue - investment) ÷ investment × 100
• ROI can be expressed as percentage or ratio (3:1)
• Always include all costs in investment calculation
• Calculating revenue as ROI instead of profit
• Forgetting to subtract investment from revenue
• Not including all costs in the investment figure
A company spent $5,000 on social media advertising and generated $15,000 in sales. Calculate the ROI and determine if it meets the industry benchmark of 4:1 (400%).
ROI calculation: ($15,000 - $5,000) / $5,000 × 100 = $10,000 / $5,000 × 100 = 200%
The ROI is 200% or 2:1 ratio, which is below the industry benchmark of 4:1 (400%). The campaign is profitable but underperforming compared to industry standards. The company earned $2 for every $1 invested, falling short of the $4 per $1 target.
This example shows how to evaluate ROI performance against benchmarks. The 200% ROI means the campaign doubled the investment, which is profitable. However, the industry benchmark of 4:1 suggests there's room for optimization. Understanding benchmarks helps identify performance gaps and set realistic improvement targets.
Industry Benchmark: Standard performance metrics for comparison
Performance Gap: Difference between actual and target performance
Profitability Threshold: Minimum ROI required to justify investment
• Compare ROI to relevant benchmarks
• Consider industry-specific standards
• Account for all costs in investment calculation
• Use platform-specific benchmarks
• Consider business model in benchmark selection
• Track trends over time for improvement
• Comparing to irrelevant benchmarks
• Not adjusting for business model differences
• Focusing only on ROI without considering other metrics
A business spent $3,000 on Facebook ads and achieved a 250% ROI, generating $7,500 in revenue. They want to achieve a 4:1 ROI (400%) while maintaining the same revenue. Calculate the maximum ad spend they can use to achieve this target ROI.
Current calculation: ($7,500 - $3,000) / $3,000 × 100 = 150% / $3,000 × 100 = 150%
Wait, that doesn't match the stated 250%. Let me recalculate: ($7,500 - $3,000) / $3,000 × 100 = $4,500 / $3,000 × 100 = 150%
To achieve 400% ROI with $7,500 revenue: 400% = ($7,500 - Investment) / Investment × 100
4 = ($7,500 - Investment) / Investment
4 × Investment = $7,500 - Investment
5 × Investment = $7,500
Investment = $7,500 / 5 = $1,500
The maximum ad spend for 400% ROI is $1,500.
This problem demonstrates algebraic manipulation of the ROI formula. When solving for investment given a target ROI and fixed revenue, we rearrange the formula algebraically. The calculation shows that to achieve a higher ROI with the same revenue, the investment must decrease proportionally. This illustrates the inverse relationship between investment and ROI when revenue is constant.
Algebraic Manipulation: Rearranging formulas to solve for different variables
Inverse Relationship: When one variable increases, the other decreases
Target ROI: Desired return on investment goal
• Use algebra to solve for unknown variables
• Understand the relationship between ROI components
• Verify calculations by substituting back into formula
• Cross-check calculations by substituting back
• Understand how variables relate to each other
• Use formulas to set realistic targets
• Incorrectly rearranging formulas
• Forgetting to verify calculations
• Not understanding variable relationships
A company runs campaigns across Instagram ($2,000 spend, 300 conversions) and TikTok ($3,000 spend, 450 conversions). If the average order value is $50, calculate the ROI for each platform and determine which is more efficient.
Instagram: Revenue = 300 × $50 = $15,000
Instagram ROI = ($15,000 - $2,000) / $2,000 × 100 = $13,000 / $2,000 × 100 = 650%
TikTok: Revenue = 450 × $50 = $22,500
TikTok ROI = ($22,500 - $3,000) / $3,000 × 100 = $19,500 / $3,000 × 100 = 650%
Both platforms have the same ROI (650%), but TikTok generates more absolute profit ($19,500 vs $13,000).
This example demonstrates multi-platform comparison. Both platforms achieved identical ROI (650%), meaning they generate the same return per dollar invested. However, TikTok generated more total profit due to higher investment and conversions. When comparing platforms, consider both ROI (efficiency) and total profit (absolute value). The choice depends on whether you prioritize efficiency or total returns.
Platform Efficiency: ROI comparison between different marketing channels
Absolute Profit: Total profit regardless of investment efficiencyChannel Attribution: Assigning value to different marketing channels
• Compare ROI across platforms for efficiency
• Consider both efficiency and absolute returns
• Factor in strategic objectives beyond ROI
• Calculate ROI per platform for fair comparison
• Consider strategic value beyond financial metrics
• Monitor both efficiency and volume metrics
• Comparing absolute numbers instead of ROI
• Ignoring strategic objectives in platform selection
• Not considering volume alongside efficiency
Which of the following is the most effective strategy for improving social media ROI?
The answer is B) Improve targeting to reach higher-value customers. Focusing on audiences more likely to convert increases the revenue per dollar spent, directly improving ROI. Better targeting means more relevant messaging to interested prospects, resulting in higher conversion rates and average order values. This approach optimizes the efficiency of every dollar spent.
This question highlights the importance of efficiency over volume in ROI optimization. While increasing ad spend (A) might increase total revenue, it doesn't improve ROI unless conversion rates remain constant. Better targeting improves the quality of traffic, leading to higher conversion rates and potentially higher average order values. This directly impacts the revenue side of the ROI equation while keeping costs controlled.
Targeting Efficiency: Reaching the right audience for maximum impact
Conversion Rate: Percentage of visitors who take desired action
Audience Segmentation: Dividing audience into targeted groups
• Focus on efficiency, not just volume
• Quality traffic is more valuable than quantity
• Test and optimize targeting continuously
• Use lookalike audiences based on high-value customers
• Leverage behavioral and interest-based targeting
• Regularly analyze audience performance data
• Focusing on reach over relevance
• Not segmenting audiences effectively
• Assuming all conversions have equal value
ROI Fundamentals
Return on Investment measures profitability of social media campaigns. Formula: (Revenue - Investment) / Investment × 100.
Target: 4:1 ratio (400% ROI). Average: 2:1 to 3:1 depending on industry and platform.
- Include all costs in investment calculation
- Track both direct and indirect revenue
- Compare to relevant benchmarks
Optimization
Targeting, content quality, timing, and platform choice all influence ROI.
- Enhance audience targeting
- Improve ad creative quality
- Optimize posting timing
- Test different content formats
- Balance short-term and long-term ROI
- Consider brand value alongside immediate sales
- Test systematically with A/B tests
- Monitor lifetime value of customers
FAQ
Q: What's a good social media ROI for 2026?
A: Target 4:1 ratio (400% ROI) as industry standard. E-commerce: 5:1+, B2B: 3:1-4:1. Include LTV for complete picture. Anything above 3:1 is considered good performance.
Q: How do I track ROI for brand awareness campaigns?
A: Use UTM parameters, track website traffic lift, measure engagement quality, monitor brand mention sentiment, and attribute delayed conversions. Brand campaigns build long-term value.