Solar Panel Calculator
Solar panel sizing & ROI calculator • Energy optimized
Solar Panel Sizing & Energy Production Formulas:
Show the calculatorEnergy Production: \( E = A \times I \times \eta \times PR \)
Panel Count: \( N = \frac{P_{req}}{P_{panel}} \)
ROI Calculation: \( ROI = \frac{Savings}{Cost} \times 100 \)
Where:
- \( E \) = energy production in kWh
- \( A \) = total panel area in m²
- \( I \) = solar irradiance in W/m²
- \( \eta \) = panel efficiency (decimal)
- \( PR \) = performance ratio (0.7-0.85)
- \( N \) = number of panels
- \( P_{req} \) = required power in watts
- \( P_{panel} \) = panel power rating in watts
- \( ROI \) = return on investment
- \( Savings \) = total savings over lifetime
- \( Cost \) = total system cost
These formulas calculate solar panel system requirements and energy production. The energy production formula accounts for panel area, solar irradiance, efficiency, and system performance. Panel count determines the number needed to meet energy requirements. ROI calculations help evaluate financial benefits.
Example: For a 5kW system with 300W panels in 5 peak sun hours:
Panel count: \( N = \frac{5000}{300} = 17 \) panels
Daily production: \( E = 17 \times 300 \times 5 \times 0.8 = 20.4 \) kWh
Annual production: \( 20.4 \times 365 = 7,446 \) kWh
Therefore, need 17 panels producing 20.4 kWh/day or 7,446 kWh/year.
Energy Requirements
Solar Conditions
Panel Specifications
Advanced Options
Solar Analysis
Comprehensive Solar Panel Guide
Solar panel systems convert sunlight into electricity through photovoltaic cells. The efficiency and output of a solar installation depend on multiple factors including panel type, location, orientation, and environmental conditions. Proper sizing ensures optimal energy production and financial returns.
Key calculations for solar panel systems:
Where:
- \(E\) = energy production in kWh
- \(A\) = total panel area in m²
- \(I\) = solar irradiance in W/m²
- \(\eta\) = panel efficiency (decimal)
- \(PR\) = performance ratio (0.7-0.85)
- \(N\) = number of panels
- \(P_{req}\) = required power in watts
- \(P_{panel}\) = panel power rating in watts
Multiple factors influence solar energy production:
- Solar Irradiance: Direct sunlight intensity varies by location
- Orientation: South-facing panels maximize production
- Tilt Angle: Optimal angle equals latitude of location
- Shading: Even partial shading significantly reduces output
- Temperature: Higher temperatures reduce efficiency
- Electricity Savings: Reduced monthly utility bills
- Tax Credits: Federal and state incentives
- Net Metering: Sell excess energy back to grid
- Property Value: Solar increases home value
- Payback Period: Typically 6-10 years
Solar Technology Fundamentals
Process by which solar cells convert light directly into electricity.
\(N = \frac{P_{req}}{P_{panel}}\)
Where N=panels needed, Preq=required power, Ppanel=panel rating.
- Solar panels produce DC electricity
- Inverters convert DC to AC for home use
- Peak sun hours vary by location and season
Financial Optimization
Measure of profitability over the system's lifetime.
- Calculate total savings over 25 years
- Subtract net system cost
- Divide by net cost and multiply by 100
- Higher electricity rates improve ROI
- More sun hours increase production
- Quality panels last 25+ years
Solar Panel Learning Quiz
How many 300W panels are needed for a 6kW solar system?
The answer is B) 20 panels. Using the formula: \( N = \frac{P_{req}}{P_{panel}} \)
N = 6000W ÷ 300W = 20 panels
Therefore, 20 panels are needed for a 6kW system.
This calculation determines the number of panels required to meet a specific power output. The formula divides the total required power by the power rating of each individual panel. This is the fundamental calculation for solar system sizing.
Power Rating: Maximum output of a solar panel under standard test conditions
Watt (W): Unit of power measurement
Kilowatt (kW): 1,000 watts
• Always round up to ensure adequate capacity
• Consider system losses when sizing
• Account for inverter efficiency
• Add 10-20% to account for system losses
• Consider future energy needs when sizing
• Check inverter compatibility with panel voltage
• Forgetting to account for system losses
• Not considering inverter voltage limitations
Calculate the daily energy production of a 5kW solar system with 5 peak sun hours and 80% performance ratio. (Formula: Daily Production = System kW × Peak Sun Hours × Performance Ratio)
Given:
- System Size = 5kW
- Peak Sun Hours = 5
- Performance Ratio = 0.80
Step 1: Apply formula: Daily Production = 5 × 5 × 0.80
Step 2: Daily Production = 25 × 0.80
Step 3: Daily Production = 20 kWh
Therefore, the system produces 20 kWh per day.
Energy production calculations account for system size, available sunlight, and system efficiency. The performance ratio incorporates losses from temperature, shading, and other factors. This calculation helps estimate the system's energy output.
Peak Sun Hours: Equivalent hours of full sun at standard test conditions
Performance Ratio: Measure of system efficiency including all losses
Kilowatt-hour (kWh): Unit of energy consumption
• Performance ratio typically ranges from 0.7 to 0.85
• Peak sun hours vary by location and season
• Real-world output is always less than theoretical
• Use historical data for accurate peak sun hours
• Consider seasonal variations in production
• Monitor system performance for degradation
• Assuming 100% performance ratio
• Not accounting for seasonal variations
A solar system costs $15,000 before incentives. The federal tax credit is 30% and there's a $1,000 state rebate. If the system saves $1,200 annually in electricity costs, what is the payback period?
Step 1: Calculate tax credit = $15,000 × 0.30 = $4,500
Step 2: Calculate net cost = $15,000 - $4,500 - $1,000 = $9,500
Step 3: Calculate payback period = $9,500 ÷ $1,200 = 7.92 years
Therefore, the payback period is approximately 7.9 years.
Payback period calculations help evaluate the financial viability of solar installations. The calculation considers all costs and incentives to determine how long it takes for savings to offset the initial investment. This is a key metric for solar investment decisions.
Payback Period: Time to recover initial investment through savings
Tax Credit: Dollar-for-dollar reduction in tax liability
Net Cost: Total cost after all incentives
• Include all incentives in cost calculations
• Account for system degradation over time
• Consider opportunity cost of invested capital
• Factor in rising electricity rates
• Include maintenance costs in calculations
• Not accounting for all available incentives
• Ignoring system degradation over time
Compare two solar panels: Panel A is 300W with 20% efficiency, Panel B is 350W with 18% efficiency. If both panels have the same area of 1.7m², which panel produces more energy per square meter?
Given:
- Panel A: 300W, 20% efficiency, 1.7m²
- Panel B: 350W, 18% efficiency, 1.7m²
Step 1: Calculate energy per m² for Panel A = 300W ÷ 1.7m² = 176.5 W/m²
Step 2: Calculate energy per m² for Panel B = 350W ÷ 1.7m² = 205.9 W/m²
Step 3: Panel B produces more energy per square meter despite lower efficiency
Therefore, Panel B produces 205.9 W/m² compared to Panel A's 176.5 W/m².
This example demonstrates that higher efficiency doesn't always mean higher power output per area. Panel B has lower efficiency but higher total output, resulting in more power per square meter. This highlights the importance of considering both efficiency and total output when evaluating panels.
Panel Efficiency: Percentage of sunlight converted to electricity
Power Density: Power output per unit area
Standard Test Conditions: 1000 W/m² irradiance, 25°C
• Efficiency and power output are different metrics
• Higher efficiency doesn't always mean higher output
• Consider available roof space when choosing panels
• High-efficiency panels are better for limited space
• Power density matters for space-constrained installations
• Consider cost per watt when comparing options
• Equating efficiency with power output
• Not considering available roof space
Which factor has the greatest impact on solar panel performance?
The answer is B) Orientation and tilt. Proper orientation (south-facing in Northern Hemisphere) and tilt angle (equal to latitude) maximize solar exposure and energy production. Poor orientation can reduce output by 20-40% compared to optimal positioning.
Orientation and tilt are critical for maximizing solar energy collection. South-facing panels with optimal tilt capture the most sunlight throughout the day. Even the best panels will underperform if poorly positioned. This demonstrates the importance of site assessment in solar design.
Orientation: Direction the panels face relative to compass directions
Tilt Angle: Angle of panels from horizontal plane
Solar Exposure: Amount of sunlight received by panels
• South-facing panels maximize production in Northern Hemisphere
• Shading even small portions significantly reduces output
• Use solar pathfinders to assess shading
• Consider seasonal sun angles in design
• Monitor performance to detect shading issues
• Installing panels without proper orientation assessment
• Not considering seasonal shading from trees/buildings
FAQ
Q: How do I calculate the number of solar panels needed for my home?
A: The basic formula is: \( N = \frac{P_{req}}{P_{panel}} \), where \( N \) is the number of panels, \( P_{req} \) is the required power in watts, and \( P_{panel} \) is the panel power rating in watts.
First, calculate your required system size: \( P_{req} = \frac{\text{Monthly Usage} \times 12}{\text{Peak Sun Hours} \times 365 \times \text{Performance Ratio}} \).
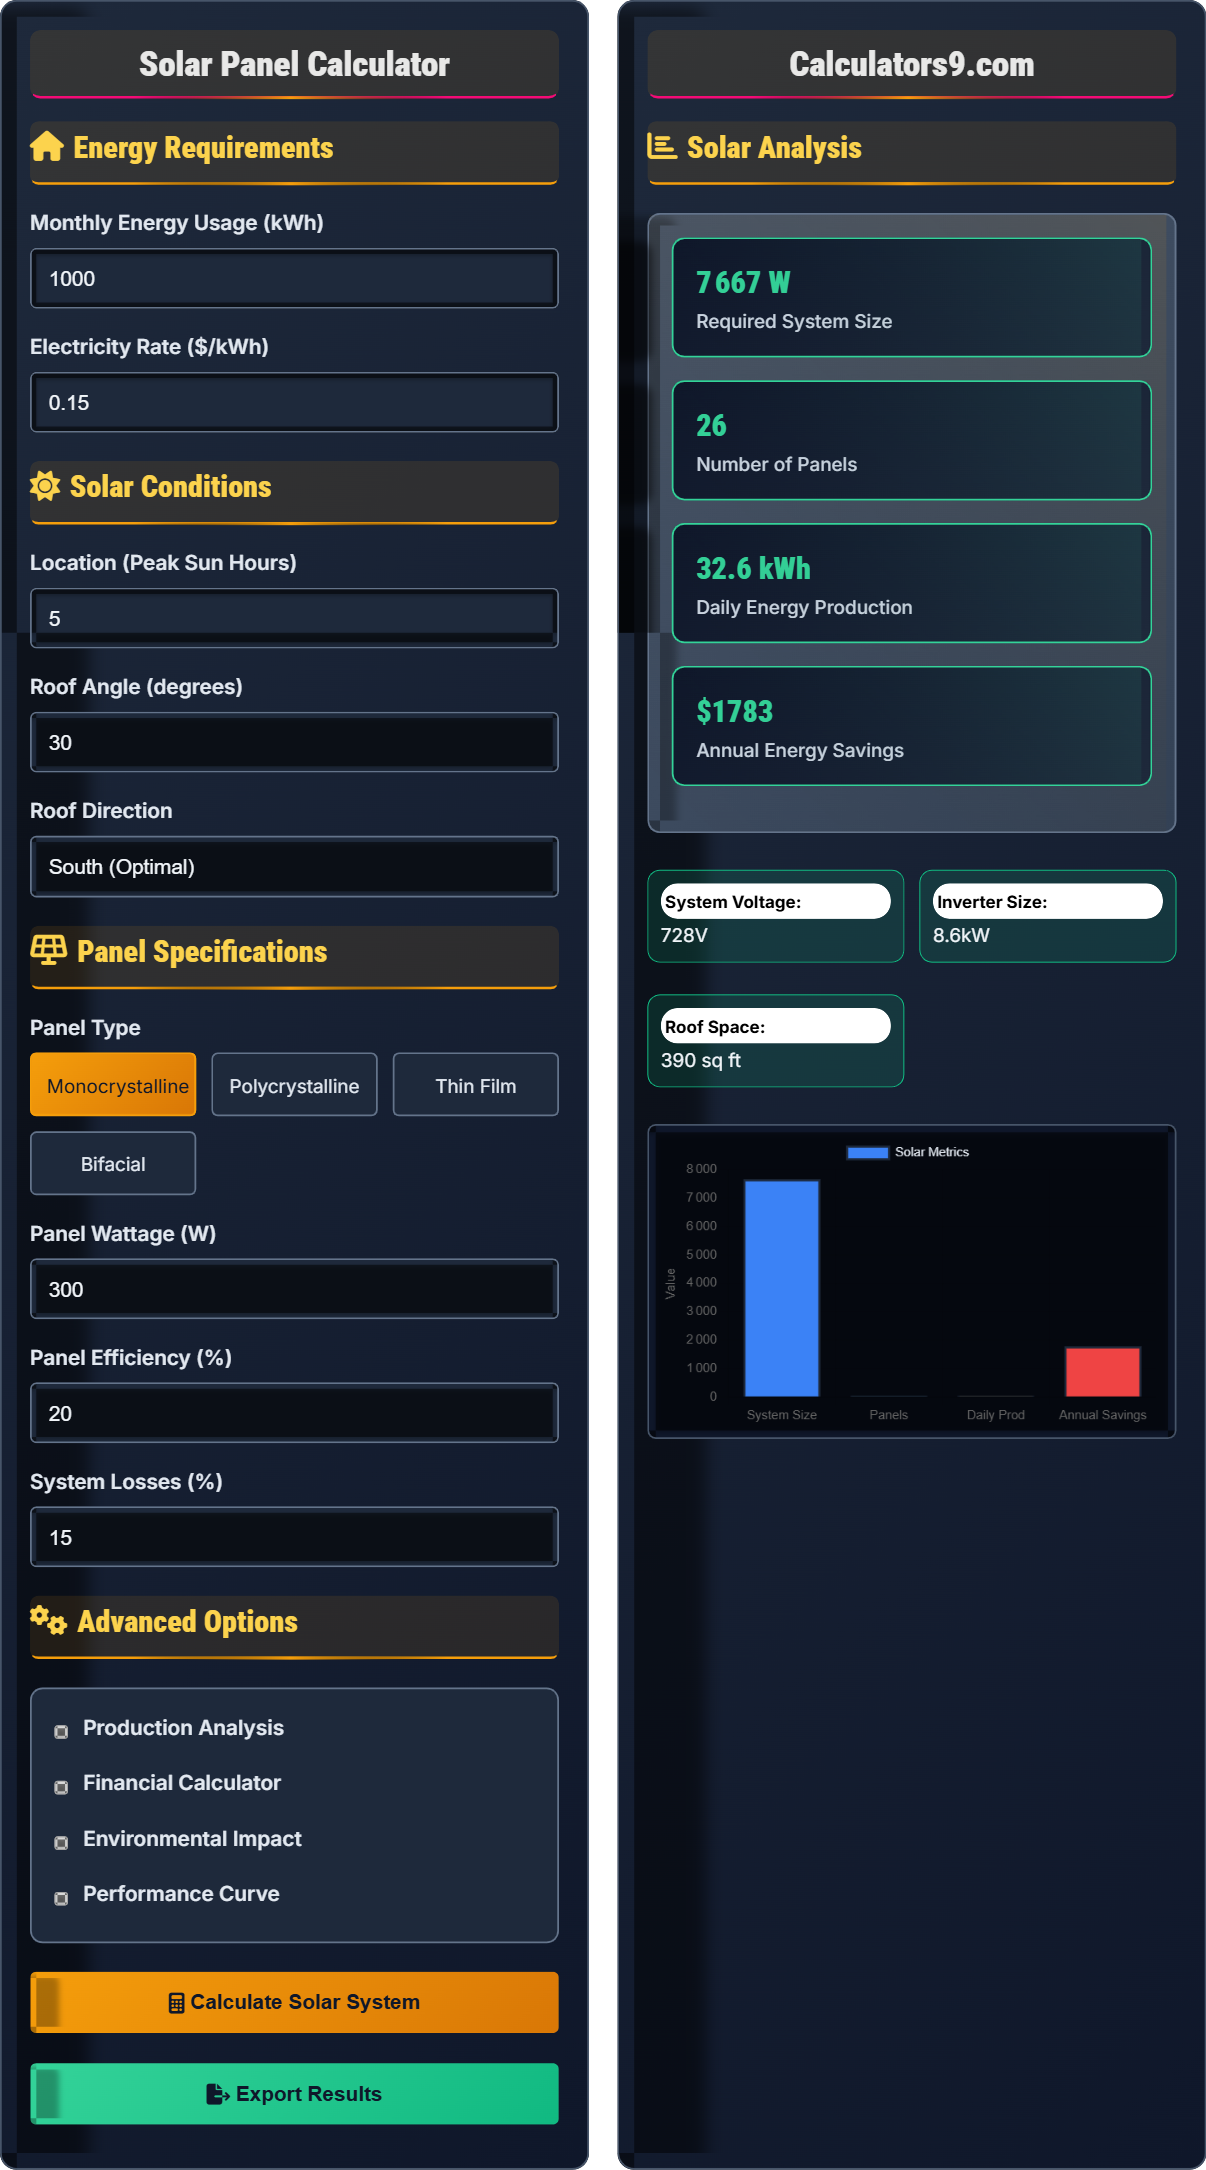
For example, with 1,000 kWh monthly usage, 5 peak sun hours, and 80% performance ratio: \( P_{req} = \frac{1000 \times 12}{5 \times 365 \times 0.8} = 8.2 \) kW. For 300W panels: \( N = \frac{8200}{300} = 27.3 \), so 28 panels needed.
Q: What's the relationship between solar irradiance and energy production?
A: Energy production is directly proportional to solar irradiance: \( E = A \times I \times \eta \times PR \), where \( E \) is energy, \( A \) is area, \( I \) is irradiance, \( \eta \) is efficiency, and \( PR \) is performance ratio.
Solar irradiance varies by location and time. At sea level, peak irradiance is approximately 1,000 W/m² under clear skies. Locations closer to the equator receive more consistent irradiance throughout the year. Seasonal variations affect daily averages.
For example, in a location with 5 peak sun hours: \( E = 1 \times 1000 \times 0.20 \times 0.8 \times 5 = 800 \) Wh per day per m² of panel area.