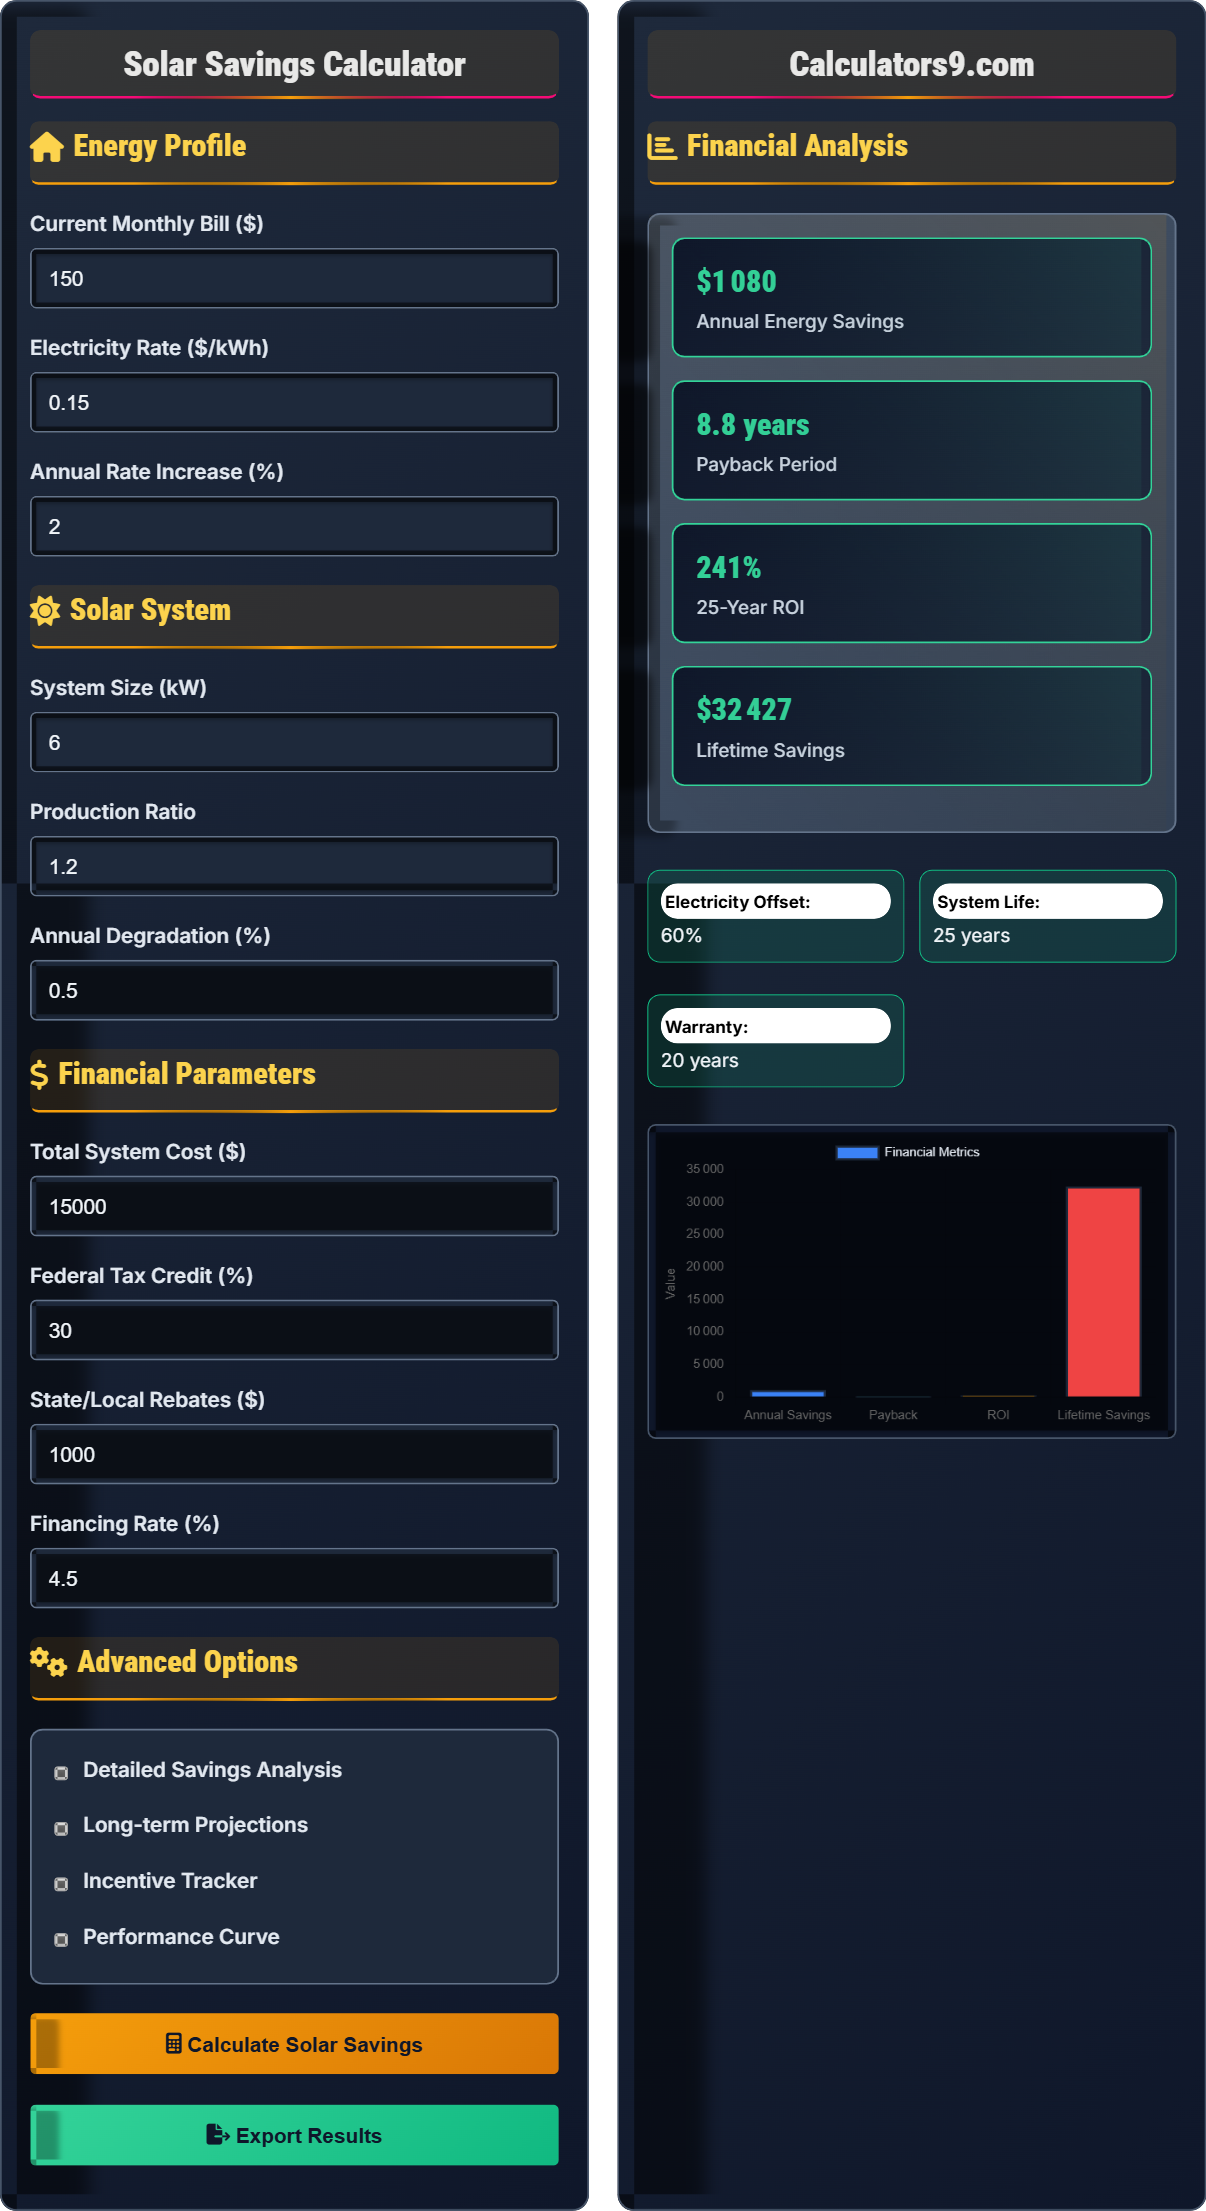
Solar Savings Calculator
Solar ROI & energy savings calculator • Finance optimized
Solar Savings & ROI Formulas:
Show the calculatorAnnual Savings: \( AS = EP \times ER \)
Payback Period: \( PP = \frac{NC}{AS} \)
ROI Calculation: \( ROI = \frac{TS - NC}{NC} \times 100 \)
Where:
- \( AS \) = annual savings in dollars
- \( EP \) = annual energy production in kWh
- \( ER \) = electricity rate in $/kWh
- \( PP \) = payback period in years
- \( NC \) = net cost after incentives
- \( TS \) = total savings over system lifetime
- \( ROI \) = return on investment percentage
These formulas calculate the financial benefits of solar panel installations. Annual savings represent the value of energy produced at current electricity rates. Payback period shows how long to recover the investment. ROI calculates the percentage return over the system's lifetime.
Example: For a system producing 8,000 kWh annually at $0.15/kWh:
Annual Savings: \( AS = 8,000 \times 0.15 = \$1,200 \)
If net cost is $10,000 after incentives:
Payback Period: \( PP = \frac{10,000}{1,200} = 8.33 \) years
Over 25-year lifetime with 2% annual rate increase:
Total Savings: \( TS = \sum_{n=0}^{24} 8,000 \times 0.15 \times (1.02)^n = \$48,500 \)
Therefore, $1,200 annual savings with 8.33 year payback and 385% ROI.
Energy Profile
Solar System
Financial Parameters
Advanced Options
Financial Analysis
Comprehensive Solar Savings Guide
Solar panel installations provide multiple financial benefits including reduced electricity bills, federal and state incentives, increased property value, and protection against rising electricity rates. The financial returns depend on local electricity rates, solar irradiance, system size, and available incentives.
Key calculations for solar financial analysis:
Where:
- \(AS\) = annual savings
- \(EP\) = annual energy production
- \(ER\) = electricity rate
- \(PP\) = payback period
- \(NC\) = net cost after incentives
Multiple factors influence solar savings:
- Electricity Rates: Higher rates improve financial returns
- Rate Structure: Time-of-use rates can enhance savings
- Net Metering: Sell excess energy back to grid
- System Size: Optimal size maximizes incentives
- Financing: Cash purchases vs. financing affect returns
- Timing: Install before incentive reductions
- Size Optimization: Maximize available incentives
- Quality: Invest in high-efficiency equipment
- Maintenance: Keep system performing optimally
- Monitoring: Track performance for optimization
Solar Finance Fundamentals
Percentage return on the solar investment over the system's lifetime.
\(ROI = \frac{TS - NC}{NC} \times 100\)
Where TS=total savings, NC=net cost.
- Higher electricity rates improve ROI
- More sun hours increase savings
- Available incentives reduce net cost
Investment Optimization
Present value of future cash flows minus initial investment.
- Calculate annual savings for each year
- Discount each year's savings to present value
- Sum discounted savings and subtract initial cost
- Positive NPV indicates profitable investment
- Higher discount rates reduce NPV
- Consider inflation in long-term projections
Solar Savings Learning Quiz
What is the payback period for a solar system that costs $12,000 after incentives and saves $1,500 annually?
The answer is B) 8 years. Using the formula: \( PP = \frac{NC}{AS} \)
PP = $12,000 ÷ $1,500 = 8 years
Therefore, the payback period is 8 years.
Payback period is a simple metric showing how long it takes to recover the initial investment through savings. This calculation helps investors understand the timeline for recouping their solar investment.
Payback Period: Time to recover initial investment through savings
Net Cost: Total cost after all incentives and rebates
Annual Savings: Value of energy produced at current rates
• Include all incentives in net cost calculation
• Consider inflation in long-term projections
• Payback doesn't account for returns beyond payback period
• Use 6-10 years as benchmark for residential systems
• Consider opportunity cost of invested capital
• Factor in rising electricity rates
• Not accounting for all available incentives
• Ignoring system degradation over time
Calculate the ROI for a solar system that costs $10,000 after incentives and generates $40,000 in total savings over its lifetime. (Formula: ROI = (Total Savings - Net Cost) ÷ Net Cost × 100)
Given:
- Net Cost = $10,000
- Total Savings = $40,000
Step 1: Apply formula: ROI = ($40,000 - $10,000) ÷ $10,000 × 100
Step 2: ROI = $30,000 ÷ $10,000 × 100
Step 3: ROI = 3 × 100 = 300%
Therefore, the ROI is 300%.
ROI measures the profitability of the solar investment as a percentage. A 300% ROI means the investment generated 3 times the initial cost in savings over its lifetime.
Return on Investment (ROI): Percentage return on investment
Total Savings: Sum of all energy bill reductions
Net Cost: Investment amount after incentives
• ROI doesn't account for timing of returns
• Consider time value of money in analysis
• Higher electricity rates improve ROI
• Compare solar ROI to other investments
• Consider tax implications of savings
• Factor in property value increases
• Not accounting for inflation in savings calculations
• Ignoring financing costs in net cost
A solar system produces 10,000 kWh annually but only uses 8,000 kWh. If the utility pays $0.10/kWh for excess energy and electricity costs $0.15/kWh, what are the annual financial benefits?
Step 1: Calculate excess production = 10,000 - 8,000 = 2,000 kWh
Step 2: Calculate avoided cost = 8,000 × $0.15 = $1,200
Step 3: Calculate revenue from excess = 2,000 × $0.10 = $200
Step 4: Calculate total annual benefits = $1,200 + $200 = $1,400
Therefore, the annual financial benefits are $1,400.
Net metering allows solar owners to sell excess energy back to the grid. The financial benefit includes both avoided electricity costs and revenue from excess production. This enhances the overall economic return of solar installations.
Net Metering: Billing arrangement for excess solar energy
Avoided Cost: Value of energy not purchased from utility
Excess Generation: Energy produced beyond consumption
• Net metering rates vary by utility
• Annual true-up may affect financial outcomes
• Size system to match consumption patterns
• Understand utility net metering policy
• Consider time-of-use rates for optimization
• Assuming all excess energy pays retail rate
• Not considering net metering caps
A solar system costs $15,000 with $4,500 in tax credits and $1,000 in rebates. If financed with a 15-year loan at 4.5% interest, what is the annual loan payment? (Use PMT function: PMT = P × r(1+r)^n ÷ [(1+r)^n - 1], where P=principal, r=monthly rate, n=months)
Step 1: Calculate net cost = $15,000 - $4,500 - $1,000 = $9,500
Step 2: Calculate monthly rate = 4.5% ÷ 12 = 0.375% = 0.00375
Step 3: Calculate months = 15 × 12 = 180
Step 4: Apply PMT formula:
PMT = $9,500 × 0.00375(1.00375)^180 ÷ [(1.00375)^180 - 1]
PMT = $9,500 × 0.00375(1.967) ÷ (0.967) = $73.80 monthly
Annual payment = $73.80 × 12 = $885.60
Therefore, the annual loan payment is approximately $886.
Financing affects the net financial benefits of solar installations. The loan payment reduces the annual savings, extending the payback period. Understanding financing costs is crucial for accurate financial projections.
Loan Payment: Monthly payment for financed solar system
Principal: Amount borrowed for solar systemInterest Rate: Cost of borrowing funds
• Higher interest rates increase loan payments
• Longer terms reduce monthly payments but increase total interest
• Compare loan rates to alternative financing
• Consider cash purchase for maximum returns
• Look for solar-specific financing with low rates
• Factor loan payments into savings calculations
• Not including loan payments in net savings
• Assuming all financing options have same terms
Which incentive has the greatest impact on solar project financial returns?
The answer is B) Federal tax credit. The federal solar tax credit typically provides 30% of the system cost directly off federal taxes. For a $15,000 system, this represents $4,500 in tax savings, which is usually the largest single incentive. This dollar-for-dollar reduction in tax liability has the most significant impact on net cost.
The federal tax credit is the most valuable solar incentive because it provides a dollar-for-dollar reduction in tax liability. Unlike deductions or credits that only reduce taxable income, the solar tax credit directly reduces taxes owed, providing maximum financial benefit.
Federal Tax Credit: Dollar-for-dollar reduction in tax liability
State Tax Credit: Reduction in state tax liability
Rebate: Direct cash payment for solar installation
• Federal tax credit is claimed in year of installation
• State incentives vary by location
• Install before federal credit phases down
• Research all available local incentives
• Consider timing for maximum benefit
• Missing federal tax credit deadline
• Not claiming all available state/local incentives
FAQ
Q: How do I calculate the financial benefits of going solar?
A: The basic calculation is: \( ROI = \frac{TS - NC}{NC} \times 100 \), where \( TS \) is total savings over the system lifetime and \( NC \) is net cost after incentives.
First, calculate annual savings: \( AS = EP \times ER \), where \( EP \) is annual energy production and \( ER \) is electricity rate.
For example, with 8,000 kWh annual production at $0.15/kWh: \( AS = 8,000 \times 0.15 = \$1,200 \) per year.
Over 25 years with 2% annual rate increase: \( TS = \sum_{n=0}^{24} 8,000 \times 0.15 \times (1.02)^n = \$48,500 \).
For a $15,000 system with $5,500 in incentives: \( NC = 15,000 - 5,500 = \$9,500 \).
Therefore: \( ROI = \frac{48,500 - 9,500}{9,500} \times 100 = 410\% \).
Q: What's the relationship between electricity rates and solar savings?
A: Savings are directly proportional to electricity rates: \( S = EP \times ER \), where \( S \) is savings, \( EP \) is energy production, and \( ER \) is electricity rate.
For example, a 6kW system producing 9,000 kWh annually:
At $0.12/kWh: \( S = 9,000 \times 0.12 = \$1,080 \) per year
At $0.20/kWh: \( S = 9,000 \times 0.20 = \$1,800 \) per year
This represents a 67% increase in savings with only a 67% increase in rates. Higher electricity rates make solar more financially attractive, as the value of each kWh produced increases proportionally.
The payback period also improves: \( PP = \frac{NC}{AS} \). With higher rates, annual savings increase, reducing payback time.