Team Ranking Calculator
Fast standings calculator • 2026 standards
Team Ranking Formulas:
Show the calculator\( Win\ Percentage = \frac{Wins}{Games\ Played} \)
\( Points\ Per\ Game = \frac{Total\ Points}{Games\ Played} \)
\( Strength\ of\ Schedule = \frac{\sum(opp\_win\_pct)}{Games\ Played} \)
Where:
- \( Wins \) = Number of games won
- \( Games\ Played \) = Total games completed
- \( Total\ Points \) = Points scored in all games
- \( opp\_win\_pct \) = Opponent's winning percentage
Alternative ranking systems:
- Points System: Wins = 3, Draws = 1, Losses = 0
- Pythagorean Expectation: \( Win\% = \frac{RS^2}{RS^2 + RA^2} \)
- Simple Rating System: Adjusts for strength of schedule
These formulas calculate team rankings based on win-loss records, point differentials, and strength of schedule. Rankings are determined by sorting teams based on these calculated values in descending order.
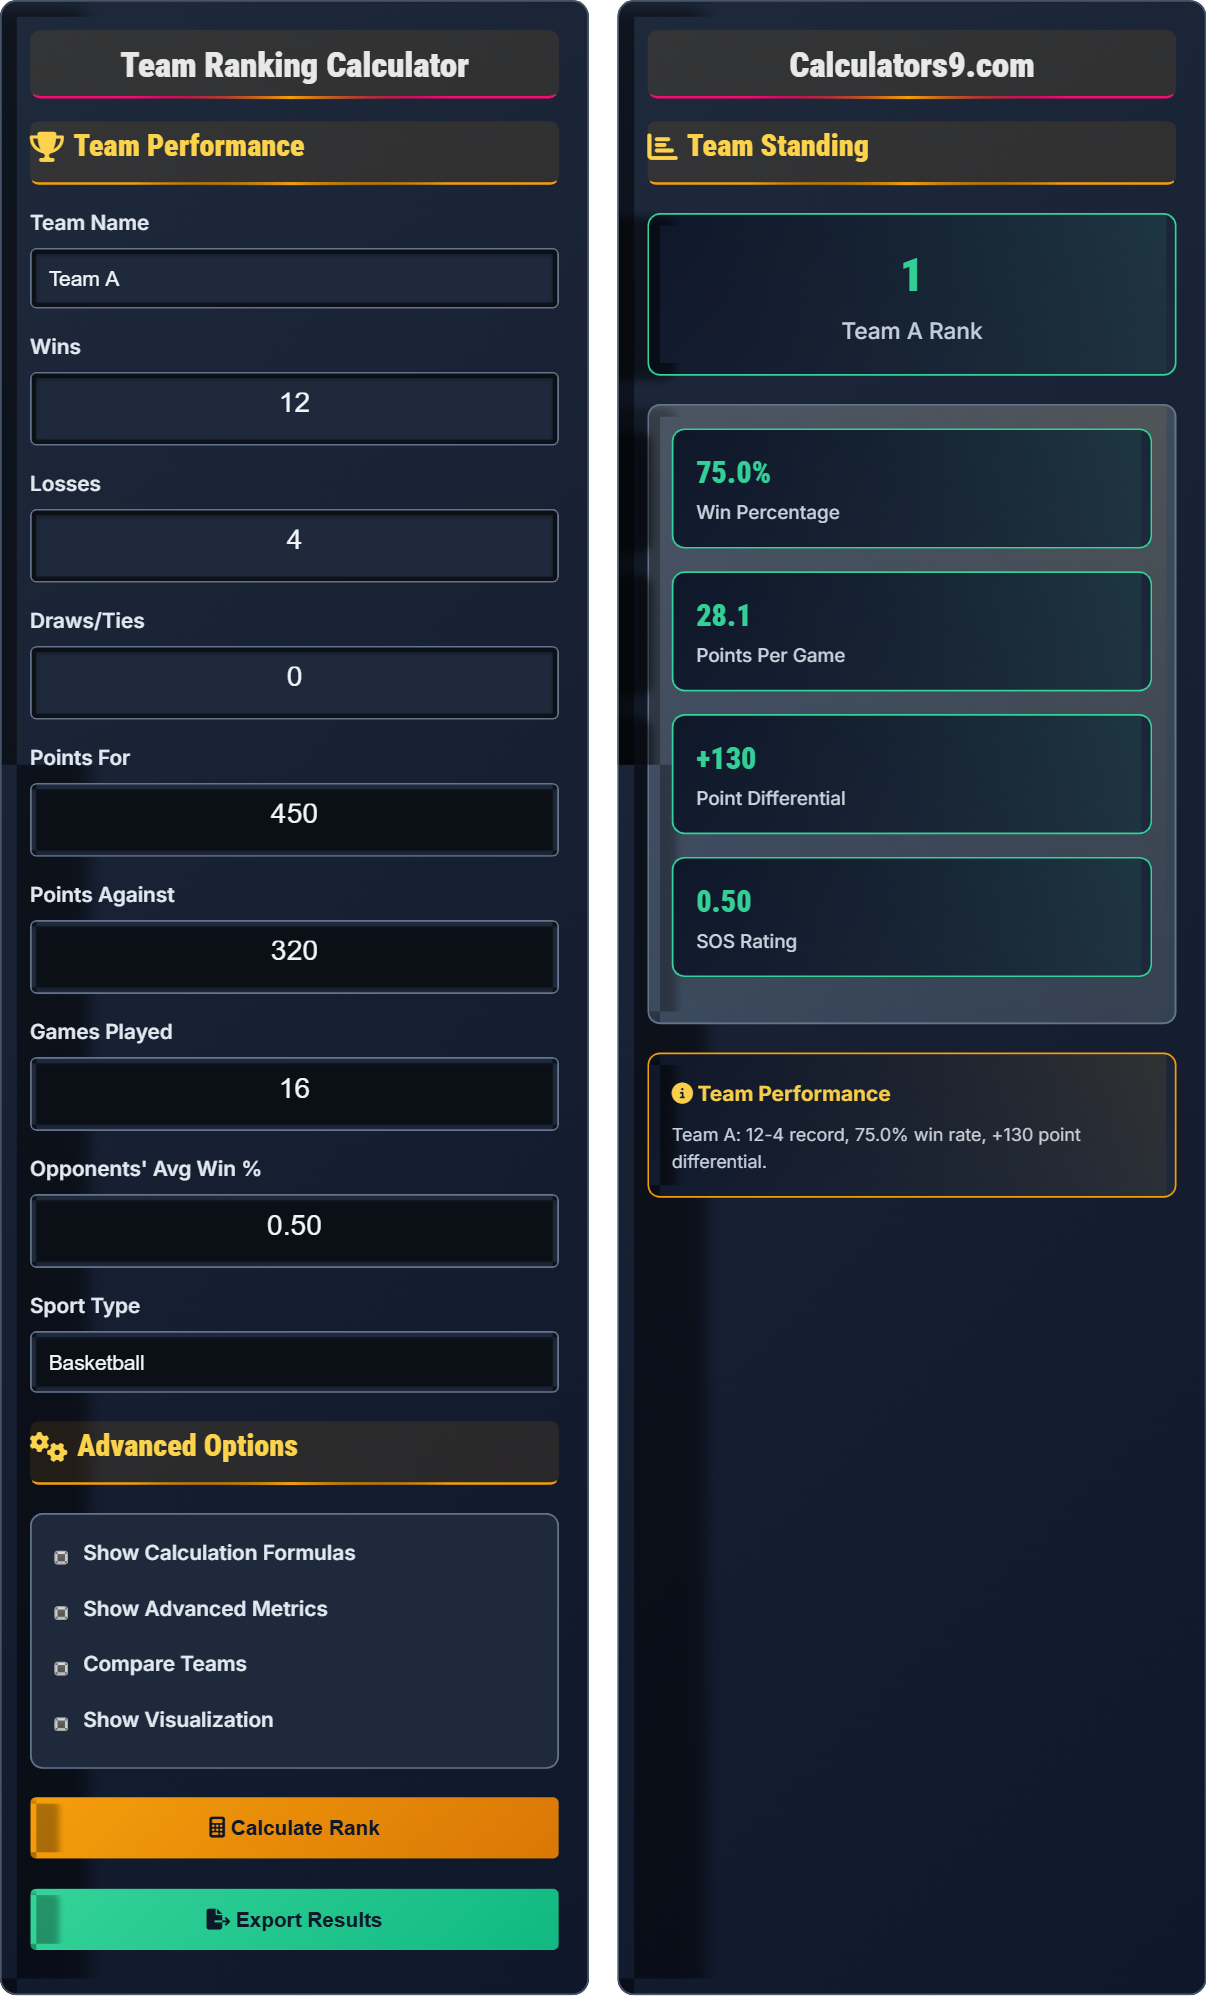
Example: Team with 12 wins, 4 losses in 16 games played:
\( Win\ Percentage = \frac{12}{16} = 0.75 = 75\% \)
Thus, the team has a 75% winning percentage.
Team Performance
Advanced Options
Team Standing
| Team | W-L | Win % | PF | PA | Diff |
|---|
| Metric | Value | League Avg | Rank |
|---|
Team Ranking Guide & Performance Analytics
Team rankings are calculated using various systems depending on the sport. Common methods include win-loss percentage, points-based systems, and advanced metrics that account for strength of schedule and point differentials. These systems provide fair comparisons between teams with different schedules and performance levels.
Key team ranking calculation formulas:
Where:
- \(Wins\) = Number of games won
- \(Games\ Played\) = Total games completed
Points System: \(Points = (Wins \times Points\ per\ Win) + (Draws \times Points\ per\ Draw)\)
Strength of Schedule: \(SOS = \frac{\sum(Opponent\ Win\%)}{Games\ Played}\)
Typical performance benchmarks by sport:
- Basketball: 60%+ Win % (Excellent), 50-59% (Good), 40-49% (Average)
- Football: 60%+ Win % (Excellent), 50-59% (Good), 40-49% (Average)
- Soccer: 65%+ Points % (Excellent), 55-64% (Good), 45-54% (Average)
- Hockey: 60%+ Points % (Excellent), 50-59% (Good), 40-49% (Average)
- Baseball: 60%+ Win % (Excellent), 50-59% (Good), 40-49% (Average)
- Context matters: Consider conference strength and schedule difficulty
- Point differential: Often better predictor than win-loss record alone
- Recent form: Weight recent games more heavily in calculations
- Home vs Away: Account for venue advantages in scheduling
- Pythagorean expectation: Predicts wins based on points scored/allowed
Ranking Basics
Quantitative measures of team effectiveness and competitive success.
\(Win\% = \frac{Wins}{Games\ Played}\)
\(Point\ Differential = Points\ For - Points\ Against\)
- Win Percentage
- Point Differential
- Strength of Schedule
- Points Per Game
Advanced Analytics
Normalized statistics that account for schedule difficulty and performance consistency.
- Strength of Schedule
- Pythagorean Expectation
- Simple Rating System
- Net Rating
- Schedule affects comparison
- Sample size matters
- Context influences results
- Multiple metrics needed
Sports Analytics Quiz
What is the formula for calculating win percentage?
The answer is B) (Wins ÷ Games Played) × 100. Win percentage is calculated by dividing the number of wins by the total number of games played, then multiplying by 100 to get a percentage. This measures the team's success rate.
Win percentage is a fundamental metric in sports that standardizes team performance regardless of the number of games played. The formula always has the successful outcomes (wins) in the numerator and the total attempts (games played) in the denominator.
Win Percentage: Measure of team success rate
Games Played: Total games completed
Success Rate: Proportion of favorable outcomes
• Numerator: Successful outcomes
• Denominator: Total attempts
• Multiply by 100 for percentage
• Higher percentage = better team
• 60%+ = excellent
• 50% = average
• Inverting the numerator and denominator
• Forgetting to multiply by 100
• Including future games in calculation
A team has won 15 games and lost 5 games. What is their win percentage? Show your work.
Using the formula: \(Win\% = \frac{Wins}{Games\ Played} \times 100\)
Step 1: Calculate total games played
\(Games\ Played = Wins + Losses = 15 + 5 = 20\)
Step 2: Apply the formula
\(Win\% = \frac{15}{20} \times 100\)
Step 3: Calculate the fraction
\(\frac{15}{20} = 0.75\)
Step 4: Multiply by 100
\(0.75 \times 100 = 75\)
Therefore, the team's win percentage is 75%.
This calculation demonstrates the straightforward application of the win percentage formula. The result shows that the team won 75% of their games, which is considered excellent in most sports (league average is typically around 50%).
Wins: Successful games completed
Games Played: Total contests completedSuccess Rate: Percentage of successful outcomes
• Include all completed games
• Divide wins by total games
• Multiply by 100 for percentage
• 75%+ Win% is excellent
• 60-74% Win% is good
• 50% Win% is average
• Forgetting to add losses to get total games
• Inverting the fraction
• Forgetting to multiply by 100
A team has scored 480 points and allowed 420 points over 16 games. What is their point differential per game? Also calculate their total point differential.
Step 1: Calculate total point differential
\(Total\ Differential = Points\ For - Points\ Against\)
\(Total\ Differential = 480 - 420 = +60\)
Step 2: Calculate point differential per game
\(Differential\ Per\ Game = \frac{Total\ Differential}{Games\ Played}\)
\(Differential\ Per\ Game = \frac{60}{16} = +3.75\)
Therefore, the team's total point differential is +60, and their point differential per game is +3.75.
Point differential is a key indicator of team performance that accounts for both offensive and defensive capabilities. A positive differential indicates the team scores more than they allow. Per-game differential normalizes for different numbers of games played.
Point Differential: Net points scored (for - against)
Points For: Total points scored by team
Points Against: Total points allowed by team
• Points For - Points Against = Differential
• Positive = good performance
• Normalize for games played
• +5+ differential per game is excellent
• +2-4 differential per game is good
• Often correlates with wins
• Subtracting Points Against from Points For
• Forgetting to divide by games played
• Confusing positive/negative signs
A team has played 10 games against opponents with the following win percentages: 0.70, 0.60, 0.55, 0.65, 0.45, 0.50, 0.75, 0.55, 0.60, 0.50. Calculate the team's strength of schedule rating.
Step 1: Sum all opponent win percentages
\(Sum = 0.70 + 0.60 + 0.55 + 0.65 + 0.45 + 0.50 + 0.75 + 0.55 + 0.60 + 0.50\)
\(Sum = 5.85\)
Step 2: Calculate average opponent win percentage
\(SOS = \frac{Sum\ of\ Opponent\ Win\%}{Number\ of\ Games}\)
\(SOS = \frac{5.85}{10} = 0.585\)
Therefore, the team's strength of schedule rating is 0.585 or 58.5%.
Strength of schedule accounts for the quality of opponents faced. A higher SOS rating indicates the team has faced stronger competition. This metric is important for comparing teams with different schedules and provides context for win-loss records.
Strength of Schedule: Average quality of opponents faced
Opponent Quality: Performance level of teams faced
Context Adjustment: Accounting for schedule difficulty
• Average opponent win percentage
• Higher SOS = tougher schedule
• Use for fair comparisons
• SOS > 0.55 = tough schedule
• SOS < 0.45 = easy schedule
• Adjust records accordingly
• Forgetting to average the values
• Including incomplete games
• Not considering opponent strength
In a soccer league where wins = 3 points, draws = 1 point, and losses = 0 points, how many points does a team earn with 8 wins, 4 draws, and 2 losses?
The answer is B) 28 points. Using the formula: Points = (Wins × 3) + (Draws × 1) + (Losses × 0)
Points = (8 × 3) + (4 × 1) + (2 × 0) = 24 + 4 + 0 = 28 points.
Many sports use points systems to rank teams. Soccer uses a 3-1-0 system (3 points for win, 1 for draw, 0 for loss), while other sports may use different systems. This creates incentives for winning rather than settling for draws.
Points System: Scoring method for team rankings
Win Bonus: Additional points for victories
Draw Value: Points awarded for ties
• Wins typically worth most points
• Draws worth intermediate points
• Losses typically worth 0 points
• Soccer: 3-1-0 system
• Hockey: 2-1-0 system
• Calculate total possible
• Forgetting to multiply by point values
• Using wrong point system
• Adding losses to total points
FAQ
Q: What's the difference between win percentage and points percentage in sports?
A: Win percentage is calculated as \(Win\% = \frac{Wins}{Games\ Played}\), representing the proportion of games won. Points percentage (used in leagues with points systems) is calculated as \(Points\% = \frac{Actual\ Points}{Maximum\ Possible\ Points}\).
For example, in soccer with 10 games played: a team with 6 wins, 2 draws, 2 losses earns 20 points (6×3 + 2×1). Maximum possible points = 10×3 = 30. Points percentage = 20/30 = 66.7%.
Win percentage = 6/10 = 60%. Points percentage accounts for draws, while win percentage only counts wins.
Q: How is Pythagorean Expectation used in sports rankings?
A: Pythagorean Expectation predicts a team's winning percentage based on points scored and allowed. The formula is:
\(Win\% = \frac{RS^2}{RS^2 + RA^2}\)
Where RS = Runs/Points Scored, RA = Runs/Points Allowed. For example, a team that scored 500 points and allowed 400 points would have:
\(Win\% = \frac{500^2}{500^2 + 400^2} = \frac{250000}{250000 + 160000} = \frac{250000}{410000} = 0.61 = 61\%\)
This often provides a better indication of true team strength than actual win-loss record, as it's less affected by luck.