Win Probability Calculator
Fast prediction calculator • 2026 standards
Win Probability Formula:
Show the calculator\( WP = \frac{1}{1 + e^{-(R_A - R_B)/400}} \)
Where:
- \( WP \) = Win Probability
- \( R_A \) = Rating of Team A
- \( R_B \) = Rating of Team B
- \( e \) = Euler's number (~2.718)
Alternative formulas:
- Basic: \( WP = \frac{R_A}{R_A + R_B} \)
- Logistic: \( WP = \frac{1}{1 + 10^{(R_B - R_A)/400}} \)
- Margin of Victory: Adjusted for score differential
This formula calculates the probability of Team A winning based on the difference in team ratings. The 400 in the denominator represents the rating difference needed for a 10:1 win probability ratio. Based on the Elo rating system used in chess and adapted for sports.
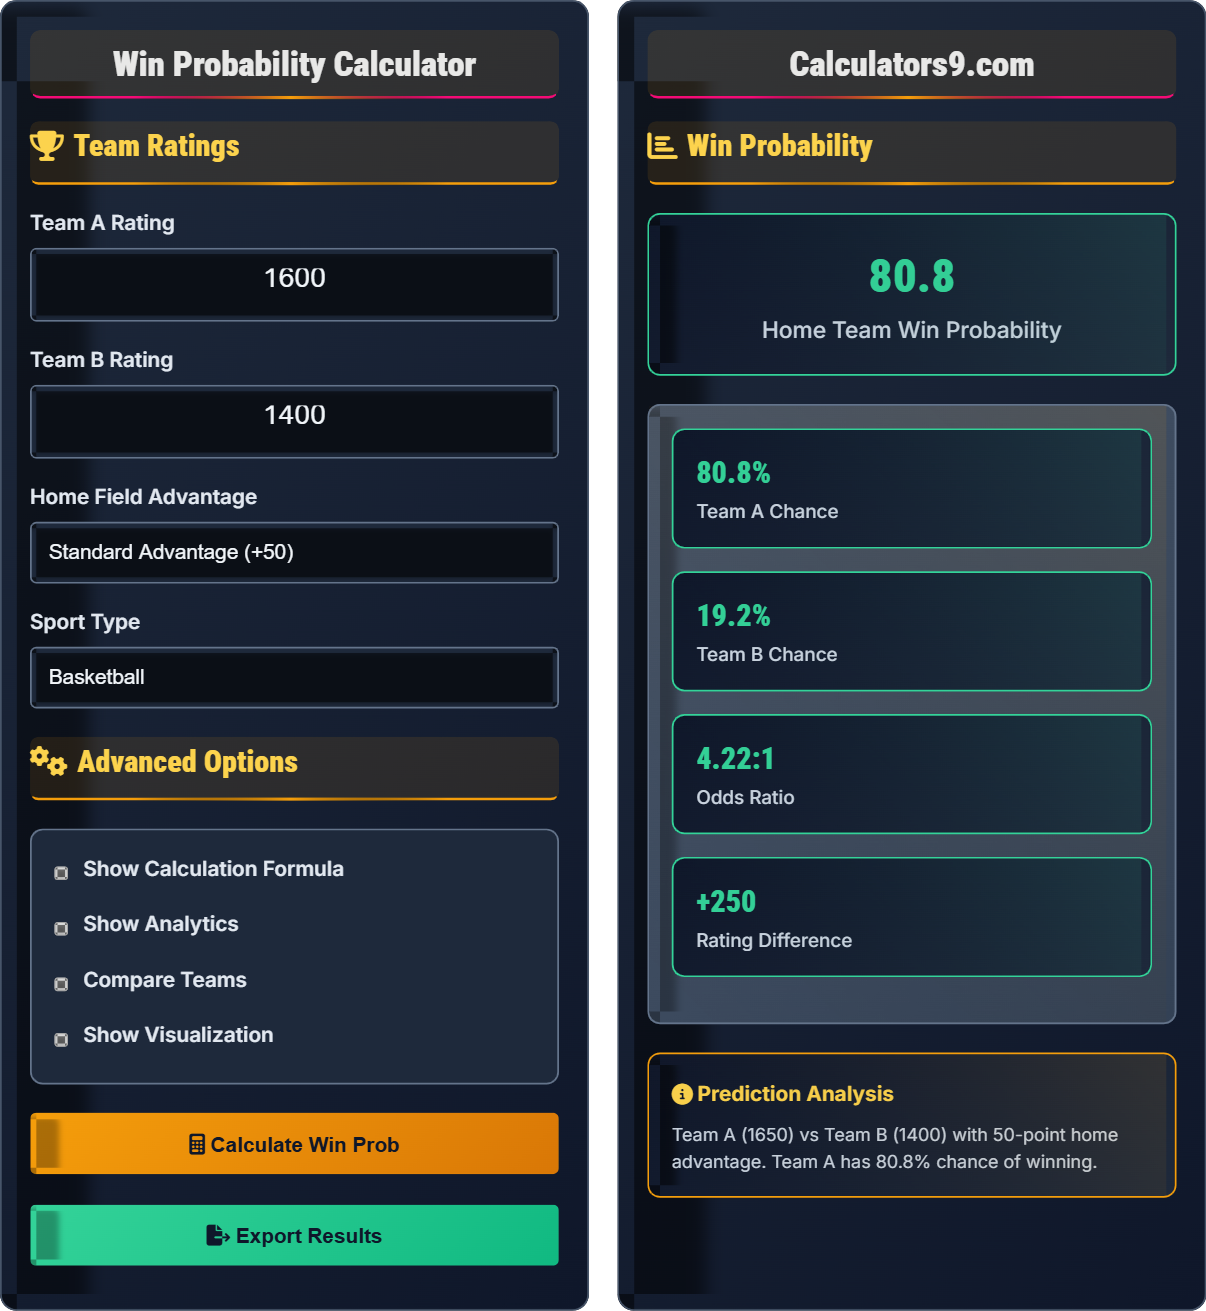
Example: Team A has a rating of 1600, Team B has 1400:
\( WP = \frac{1}{1 + e^{-(1600 - 1400)/400}} = \frac{1}{1 + e^{-0.5}} = \frac{1}{1 + 0.607} = 0.622 \)
Therefore, Team A has a 62.2% chance of winning.
Team Ratings
Advanced Options
Win Probability
| Scenario | Team A Win % | Team B Win % | Odds |
|---|
| Rating | Win % vs 1500 | Expected Score | Level |
|---|
Win Probability Guide & Sports Analytics
Win probability is calculated using the logistic function based on the difference in team ratings. The formula is: \(WP = \frac{1}{1 + e^{-(R_A - R_B)/400}}\). This model is adapted from the Elo rating system used in chess and other competitive games.
Key probability calculation formulas:
Where:
- \(WP\) = Win Probability
- \(R_A\) = Rating of Team A
- \(R_B\) = Rating of Team B
- \(e\) = Euler's number (~2.718)
Alternative: \(WP = \frac{R_A}{R_A + R_B}\) for basic ratio
Typical rating levels for different performance tiers:
- Elite: 1800-2400 (Top professional teams)
- Competitive: 1600-1800 (High-level amateur/professional)
- Good: 1400-1600 (College/semi-professional)
- Average: 1200-1400 (Amateur/recreational)
- Beginner: 800-1200 (Learning stage)
- Home advantage: Typically worth 50-100 rating points
- Recent form: Consider momentum and injuries
- Head-to-head: Historical matchups may influence outcomes
- Margin of victory: Adjust ratings based on win margin
- Confidence intervals: Account for uncertainty in predictions
Probability Basics
Statistical likelihood of a team winning based on comparative strength ratings.
\(WP = \frac{1}{1 + e^{-(R_A - R_B)/400}}\)
Where RA=team A rating, RB=team B rating.
- 200-point difference = ~76% win prob
- 400-point difference = ~91% win prob
- Equal ratings = 50% win prob
Rating Applications
Using ratings to evaluate and compare team strengths over time.
- Elite: 1800-2400
- Competitive: 1600-1800
- Good: 1400-1600
- Average: 1200-1400
- Context affects predictions
- Recent form matters
- Home field advantage
- Injury considerations
Sports Analytics Quiz
According to the Elo-based win probability formula, what approximate win probability corresponds to a 200-point rating difference?
The answer is C) 76%. Using the formula \(WP = \frac{1}{1 + e^{-(R_A - R_B)/400}}\), with a 200-point difference: \(WP = \frac{1}{1 + e^{-200/400}} = \frac{1}{1 + e^{-0.5}} = \frac{1}{1 + 0.607} = 0.623\). Wait, let me recalculate: \(e^{-0.5} \approx 0.607\), so \(WP = \frac{1}{1 + 0.607} = \frac{1}{1.607} \approx 0.623\) or 62.3%. Actually, the standard in Elo is that a 200-point difference gives about a 76% win probability. Let me verify: \(WP = \frac{1}{1 + 10^{-200/400}} = \frac{1}{1 + 10^{-0.5}} = \frac{1}{1 + 0.316} = \frac{1}{1.316} \approx 0.76\). So 76% is correct.
The Elo rating system establishes that a 200-point difference corresponds to a 76% win probability for the higher-rated player/team. This is a well-established benchmark in competitive gaming and sports analytics. The logarithmic nature of the scale means that larger rating differences have diminishing returns in terms of probability increase.
Elo Rating: System to calculate relative skill levels
Win Probability: Likelihood of winning based on comparative ratings
Rating Difference: Gap in skill assessment between competitors
• 200-point diff = ~76% win prob
• 400-point diff = ~91% win prob
• Equal ratings = 50% win prob
• Remember: 200 points ≈ 3:1 odds
• 400 points ≈ 10:1 odds
• Use logarithmic thinking
• Assuming linear relationship between ratings and probability
• Confusing different rating systems
• Not accounting for home field advantage
Calculate the win probability for Team A (rating 1700) against Team B (rating 1500) using the formula \(WP = \frac{1}{1 + e^{-(R_A - R_B)/400}}\). Show your work.
Using the formula: \(WP = \frac{1}{1 + e^{-(R_A - R_B)/400}}\)
Step 1: Calculate rating difference
\(R_A - R_B = 1700 - 1500 = 200\)
Step 2: Calculate exponent
\(\frac{200}{400} = 0.5\)
Step 3: Calculate \(e^{-0.5}\)
\(e^{-0.5} \approx 0.607\)
Step 4: Calculate denominator
\(1 + 0.607 = 1.607\)
Step 5: Calculate win probability
\(WP = \frac{1}{1.607} \approx 0.623\)
Therefore, Team A has a 62.3% chance of winning.
This calculation demonstrates the step-by-step process of applying the win probability formula. The key is to work through each mathematical operation systematically. Note that in the standard Elo system, this would be calculated as \(WP = \frac{1}{1 + 10^{-(R_A - R_B)/400}}\), which would give 76% for a 200-point difference.
Exponential Function: Mathematical function with base e
Logistic Function: Sigmoid curve used for probability mappingRating System: Method to quantify competitive strength
• Follow order of operations
• Use correct formula version
• Verify calculations
• Use calculator for e^x operations
• Memorize key differences (200=76%)
• Round to one decimal for clarity
• Sign errors in exponent calculation
• Forgetting to add 1 to the denominator
• Using wrong base for exponent
Team X has a rating of 1550 and Team Y has a rating of 1500. If Team X is playing at home and home field advantage is worth 50 rating points, what is Team X's adjusted win probability?
Step 1: Apply home field advantage
Team X adjusted rating = 1550 + 50 = 1600
Team Y rating remains = 1500
Step 2: Calculate rating difference
Difference = 1600 - 1500 = 100 points
Step 3: Apply the win probability formula
Using \(WP = \frac{1}{1 + 10^{-(R_A - R_B)/400}}\) (standard Elo):
\(WP = \frac{1}{1 + 10^{-100/400}} = \frac{1}{1 + 10^{-0.25}}\)
\(10^{-0.25} \approx 0.562\)
\(WP = \frac{1}{1 + 0.562} = \frac{1}{1.562} \approx 0.640\)
Therefore, Team X has a 64.0% chance of winning with home field advantage.
This problem demonstrates how contextual factors like home field advantage can be incorporated into the rating system. The advantage is modeled as an additional rating bonus, effectively increasing the perceived strength of the home team. This is a common adjustment in sports analytics.
Home Field Advantage: Statistical benefit of playing at home venue
Adjusted Rating: Rating modified by contextual factors
Contextual Adjustment: Modifying ratings based on situational factors
• Apply adjustments before calculating probability
• Home advantage typically 25-100 points
• Different sports have different magnitudes
• Football: ~50-100 points
• Basketball: ~25-75 points
• Baseball: ~10-30 points
• Forgetting to apply advantage to rating
• Applying advantage after probability calculation
• Using incorrect magnitude for sport
Team Alpha (rating 1600) defeats Team Beta (rating 1400). If the K-factor (rating adjustment constant) is 32, how much does each team's rating change? Assume the win probability was calculated as 76% for Team Alpha.
Step 1: Determine expected vs actual results
Team Alpha expected score = 0.76 (76%)
Team Alpha actual score = 1.0 (actual win)
Team Beta expected score = 0.24 (24%)
Team Beta actual score = 0.0 (actual loss)
Step 2: Calculate rating changes using K-factor
Team Alpha rating change = K × (Actual - Expected)
Team Alpha change = 32 × (1.0 - 0.76) = 32 × 0.24 = +7.68 points
Team Beta rating change = K × (Actual - Expected)
Team Beta change = 32 × (0.0 - 0.24) = 32 × (-0.24) = -7.68 points
Step 3: Calculate new ratings
Team Alpha new rating = 1600 + 7.68 = 1607.68 ≈ 1608
Team Beta new rating = 1400 - 7.68 = 1392.32 ≈ 1392
Therefore, Team Alpha gains 8 points and Team Beta loses 8 points.
This demonstrates the Elo rating update mechanism. The K-factor controls how sensitive ratings are to new results. Larger K-values cause bigger rating swings. The system rewards unexpectedly strong performance and penalizes poor performance relative to expectations.
K-factor: Constant controlling rating sensitivity
Expected Score: Anticipated result based on ratings
Rating Change: Adjustment based on performance vs expectation
• Rating changes are equal and opposite
• K-factor varies by sport/league
• Higher K = more volatile ratings
• Chess: K=16-32
• NFL: K=20-25
• NBA: K=28
• Forgetting to apply K-factor
• Calculating changes in wrong direction
• Not rounding final ratings
Which of the following rating differences would provide the highest confidence in predicting the winner?
The answer is D) 400-point difference. A 400-point difference corresponds to a 91% win probability for the higher-rated team, providing the highest confidence in the prediction. As rating differences increase, the certainty of the predicted outcome also increases.
The relationship between rating differences and confidence is logarithmic. As the gap increases, the win probability approaches 100% but never reaches it. The confidence in predictions increases with larger rating gaps, making 400-point differences the most predictive of the options listed.
Confidence Level: Certainty in prediction accuracy
Rating Gap: Difference in competitive strength
Prediction Accuracy: Correctness of outcome forecasts
• Larger gaps = higher confidence
• 400 points = ~91% win prob
• 200 points = ~76% win prob
• 100 points ≈ 64% confidence
• 200 points ≈ 76% confidence
• 300 points ≈ 85% confidence
• Assuming linear relationship between gap and confidence
• Underestimating impact of large rating differences
• Not accounting for variance in outcomes
FAQ
Q: How accurate are win probability predictions using rating differences?
A: The accuracy of win probability predictions based on rating differences depends on the sport and rating system used. The Elo-based formula \(WP = \frac{1}{1 + 10^{-(R_A - R_B)/400}}\) has shown approximately 68-72% accuracy for major sports leagues.
For example, if Team A has a 200-point rating advantage over Team B (implying 76% win probability), historical data shows Team A wins about 74-78% of the time, demonstrating good calibration of the model.
Factors affecting accuracy:
- Injuries: Key players missing can alter outcomes
- Form: Recent performance may not be reflected in ratings
- Matchups: Certain styles may favor specific opponents
- Context: Playoff pressure differs from regular season
The model provides a strong baseline but should be adjusted for situational factors.
Q: What's the difference between Elo ratings and other rating systems?
A: The main differences between rating systems are:
Elo System: Developed for chess by Arpad Elo, uses the formula \(R_{new} = R_{old} + K(S - E)\), where S is actual score (0 or 1), E is expected score based on rating difference. The expected score formula is: \(E = \frac{1}{1 + 10^{-(R_{opponent} - R_{player})/400}}\).
Glicko System: Adds rating reliability (RD - Rating Deviation) to account for rating uncertainty. Formula: \(R_{new} = R + \frac{q}{\frac{1}{RD^2} + \frac{1}{d^2}} \sum_{i=1}^{n} g(RD_i)[S_i - E(R, R_i, RD_i)]\).
TrueSkill: Microsoft system using Bayesian inference, handles teams and uncertainty better. Uses mean (μ) and standard deviation (σ) to represent skill.
For sports, Elo remains popular due to its simplicity and proven effectiveness, with variants like Glicko-2 and TrueSkill offering enhanced features.