Variance Calculator
Fast variance analysis • 2026 edition
Variance Formulas:
Show the calculatorPopulation Variance: \(\sigma^2 = \frac{\sum_{i=1}^{N}(x_i - \mu)^2}{N}\)
Sample Variance: \(s^2 = \frac{\sum_{i=1}^{n}(x_i - \bar{x})^2}{n-1}\)
Standard Deviation: \(\sigma = \sqrt{\sigma^2}\)
Variance measures how spread out values are in a dataset. It's the average of the squared differences from the mean. Population variance uses N in the denominator, while sample variance uses (n-1) for unbiased estimation.
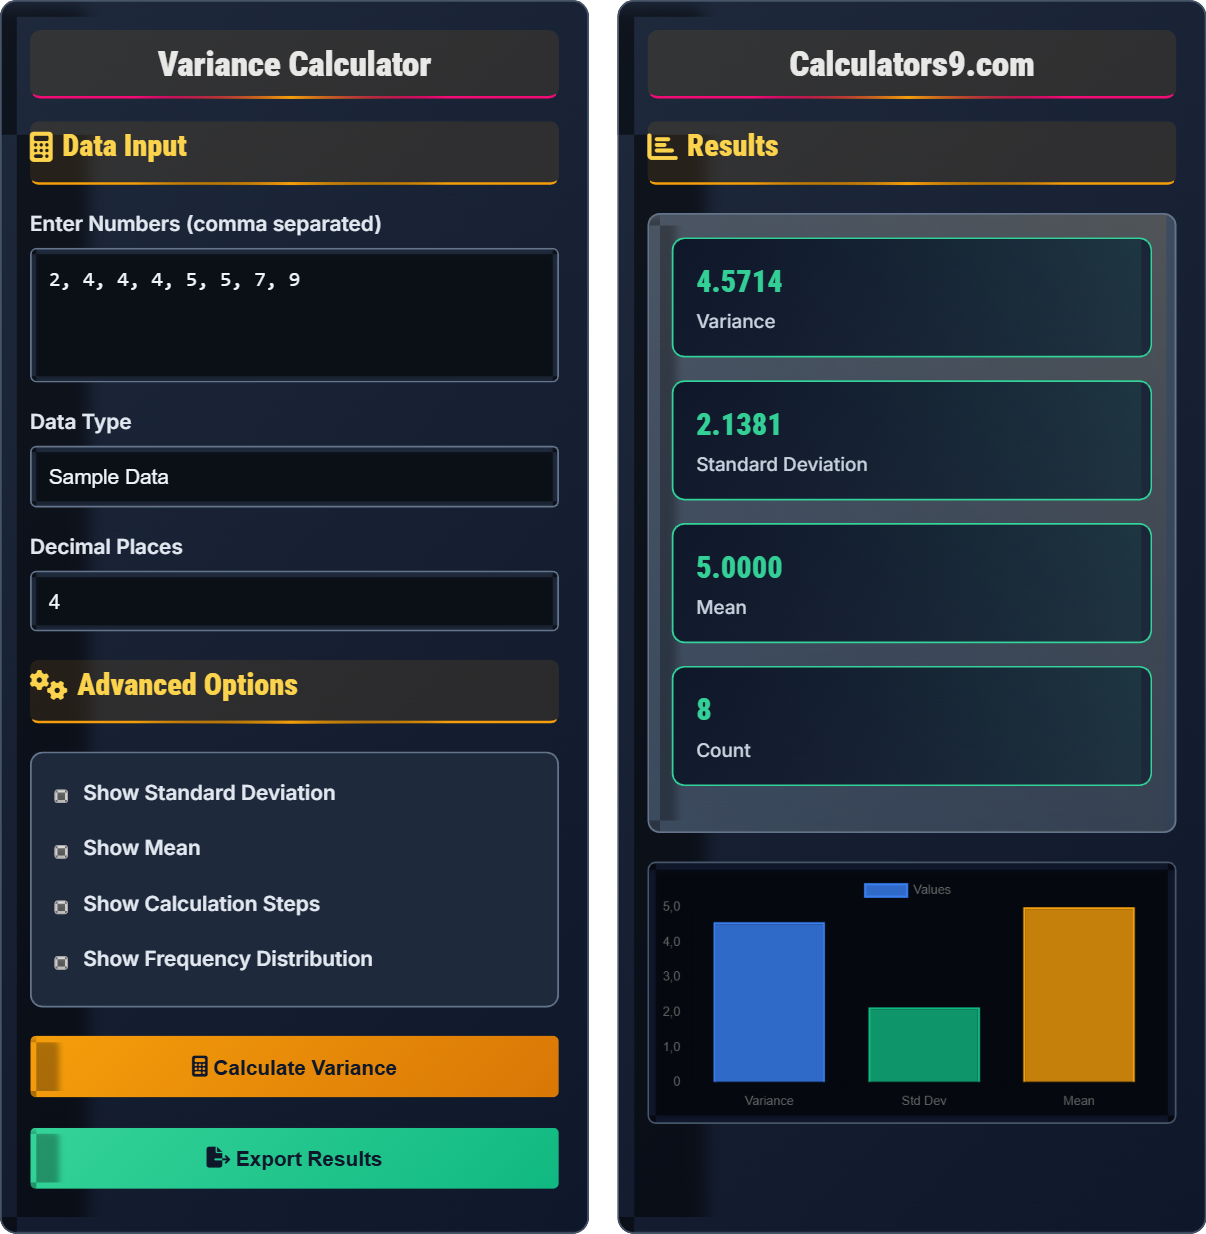
Example: For dataset [2, 4, 4, 4, 5, 5, 7, 9]:
- Mean: (2+4+4+4+5+5+7+9)/8 = 40/8 = 5
- Squared differences: (2-5)², (4-5)², ..., (9-5)² = 9, 1, 1, 1, 0, 0, 4, 16
- Sum of squared differences: 9+1+1+1+0+0+4+16 = 32
- Population variance: 32/8 = 4
- Sample variance: 32/7 ≈ 4.57
- Standard deviation: √4 = 2
These measures help quantify the dispersion of data points around the mean.
Data Input
Advanced Options
Results
| Statistic | Value |
|---|---|
| Variance | 4.5714 |
| Count | 8 |
| Statistic | Value |
|---|---|
| Minimum | 2 |
| Maximum | 9 |
| Range | 7 |
| Sum of Squares | 32 |
Comprehensive Variance Guide
Variance is a statistical measure that quantifies the spread or dispersion of a set of data points around their mean value. It indicates how far each number in the set is from the mean and thus from every other number in the set. A high variance indicates that the data points are spread out widely, while a low variance indicates that they are clustered closely around the mean.
There are two main variance formulas depending on whether you're working with population or sample data:
Population Variance: \(\sigma^2 = \frac{\sum_{i=1}^{N}(x_i - \mu)^2}{N}\)
Sample Variance: \(s^2 = \frac{\sum_{i=1}^{n}(x_i - \bar{x})^2}{n-1}\)
Where:
- \(\sigma^2\) = population variance
- \(s^2\) = sample variance
- \(x_i\) = individual data values
- \(\mu\) = population mean
- \(\bar{x}\) = sample mean
- \(N\) = population size
- \(n\) = sample size
To calculate variance, follow these steps:
Standard deviation is the square root of variance and is expressed in the same units as the original data. It provides a more intuitive measure of dispersion because it's in the same units as the data:
\(\sigma = \sqrt{\sigma^2}\)
\(s = \sqrt{s^2}\)
- Quality Control: Measuring consistency in manufacturing
- Finance: Assessing investment risk
- Research: Analyzing experimental data reliability
- Education: Evaluating test score consistency
Variance Concepts
Average of squared differences from the mean.
\(\sigma^2 = \frac{\sum(x_i - \mu)^2}{N}\)
For population data; use n-1 for samples.
- Always non-negative
- Units are squared
- Higher value = more spread
Advanced Statistics
Use n-1 for unbiased sample estimates.
\(s^2 = \frac{\sum(x_i - \bar{x})^2}{n-1}\)
- Uses n-1 instead of n
- Provides unbiased estimate
- Accounts for sample variability
- Sample variance > population variance
- Use sample when data is subset
- Use population when data is complete
Variance Learning Quiz
Why do we divide by (n-1) instead of n when calculating sample variance?
The answer is B) To correct for bias in the estimation. Dividing by (n-1) instead of n is known as Bessel's correction. When we calculate the sample variance, we use the sample mean (x̄) instead of the unknown population mean (μ). Since the sample mean is calculated from the same data, it tends to be closer to the data points than the true population mean, leading to an underestimate of the variance. By dividing by (n-1) instead of n, we correct for this bias and obtain an unbiased estimator of the population variance.
This concept is fundamental in statistics. When we use sample data to estimate population parameters, our estimates can be systematically too high or too low (biased). Bessel's correction addresses this by adjusting the denominator, ensuring that on average, our sample variance equals the true population variance. This makes the sample variance a "better" estimator of the population parameter.
Bessel's correction: Using (n-1) in the denominator to correct for bias in sample variance
Unbiased estimator: An estimator whose expected value equals the true parameter value
Degrees of freedom: The number of independent pieces of information in a calculation
• Use n for population variance
• Use (n-1) for sample variance
• Bessel's correction prevents underestimation
• Remember "n-1" for samples
• Think of it as accounting for the sample mean constraint
• The correction becomes less significant as sample size increases
• Using n instead of (n-1) for sample variance
• Confusing population and sample variance formulas
• Forgetting why Bessel's correction is necessary
Given the dataset: [10, 12, 14, 16, 18], calculate the population variance step by step. Show all intermediate calculations.
Step 1: Calculate the mean
Mean (μ) = (10 + 12 + 14 + 16 + 18) ÷ 5 = 70 ÷ 5 = 14
Step 2: Find differences from mean
10 - 14 = -4
12 - 14 = -2
14 - 14 = 0
16 - 14 = 2
18 - 14 = 4
Step 3: Square the differences
(-4)² = 16
(-2)² = 4
(0)² = 0
(2)² = 4
(4)² = 16
Step 4: Sum the squared differences
Sum of squares = 16 + 4 + 0 + 4 + 16 = 40
Step 5: Divide by the number of values (for population variance)
Population variance (σ²) = 40 ÷ 5 = 8
Step 6: Calculate standard deviation
Standard deviation (σ) = √8 ≈ 2.83
Final Answer:
Population variance = 8
Standard deviation ≈ 2.83
This step-by-step approach highlights why we square the differences: to eliminate negative values and emphasize larger deviations. The squaring ensures that both positive and negative deviations contribute equally to the variance. Notice how the sum of differences from the mean always equals zero (−4 + −2 + 0 + 2 + 4 = 0), which is why we need to square the differences to measure dispersion.
Sum of squares: The sum of squared differences from the mean
Dispersion: How spread out values are in a dataset
Population variance: Variance calculated using all data points in a population
• Always square differences before summing
• Sum of raw differences from mean is always 0
• Variance is never negative
• Create a table to organize calculations
• Verify that sum of differences equals zero
• Standard deviation is in same units as original data
• Forgetting to square the differences
• Using (n-1) for population variance
• Arithmetic errors in calculations
FAQ
Q: Why do we square the differences in variance calculation instead of just taking the absolute values?
A: We square the differences for several important reasons:
1. Mathematical Properties: Squaring creates a smooth, differentiable function that's easier to work with mathematically. This allows us to use calculus for optimization and derive important statistical results.
2. Emphasizing Larger Deviations: Squaring amplifies the effect of larger deviations more than smaller ones. A value that's 2 units away from the mean contributes 4 to the variance (2²), while a value that's 3 units away contributes 9 (3²). This gives more weight to outliers, which is often desirable.
3. Connection to Normal Distribution: Variance is fundamental to the normal distribution and many other statistical concepts. The normal distribution's probability density function involves variance directly.
4. Standard Deviation: Taking the square root of variance gives us standard deviation, which is in the same units as the original data, making it more interpretable.
While absolute deviations (mean absolute deviation) are sometimes used, variance and standard deviation remain the preferred measures due to these mathematical advantages.
Q: When should I use population variance versus sample variance?
A: The choice between population and sample variance depends on your data:
Use Population Variance when: You have data for the entire population of interest. For example, if you're analyzing the heights of all students in a specific school (and that's the population you care about), use population variance with the formula σ² = Σ(xi - μ)²/N.
Use Sample Variance when: You have a subset of data that represents a larger population. For example, if you survey 100 students from a university to estimate the variance of all university students' heights, use sample variance with the formula s² = Σ(xi - x̄)²/(n-1).
The key difference is the denominator: N for population (divides by total count) and (n-1) for sample (Bessel's correction). This correction accounts for the fact that when estimating population parameters from a sample, we lose one degree of freedom because we're using the sample mean instead of the unknown population mean.