Beta Stock Calculator
Risk analysis tool • 2026 standards
Beta Coefficient Formula:
Show the calculator\( \beta = \frac{\text{Covariance}(R_s, R_m)}{\text{Variance}(R_m)} \)
\( \beta = \frac{\rho_{s,m} \times \sigma_s}{\sigma_m} \)
Where:
- \( \beta \) = Beta coefficient (measure of systematic risk)
- \( R_s \) = Stock returns
- \( R_m \) = Market returns
- \( \rho_{s,m} \) = Correlation between stock and market returns
- \( \sigma_s \) = Standard deviation of stock returns
- \( \sigma_m \) = Standard deviation of market returns
Beta measures the sensitivity of a stock's returns to market movements. A beta of 1 indicates the stock moves with the market, while betas above 1 indicate higher volatility and below 1 indicate lower volatility than the market.
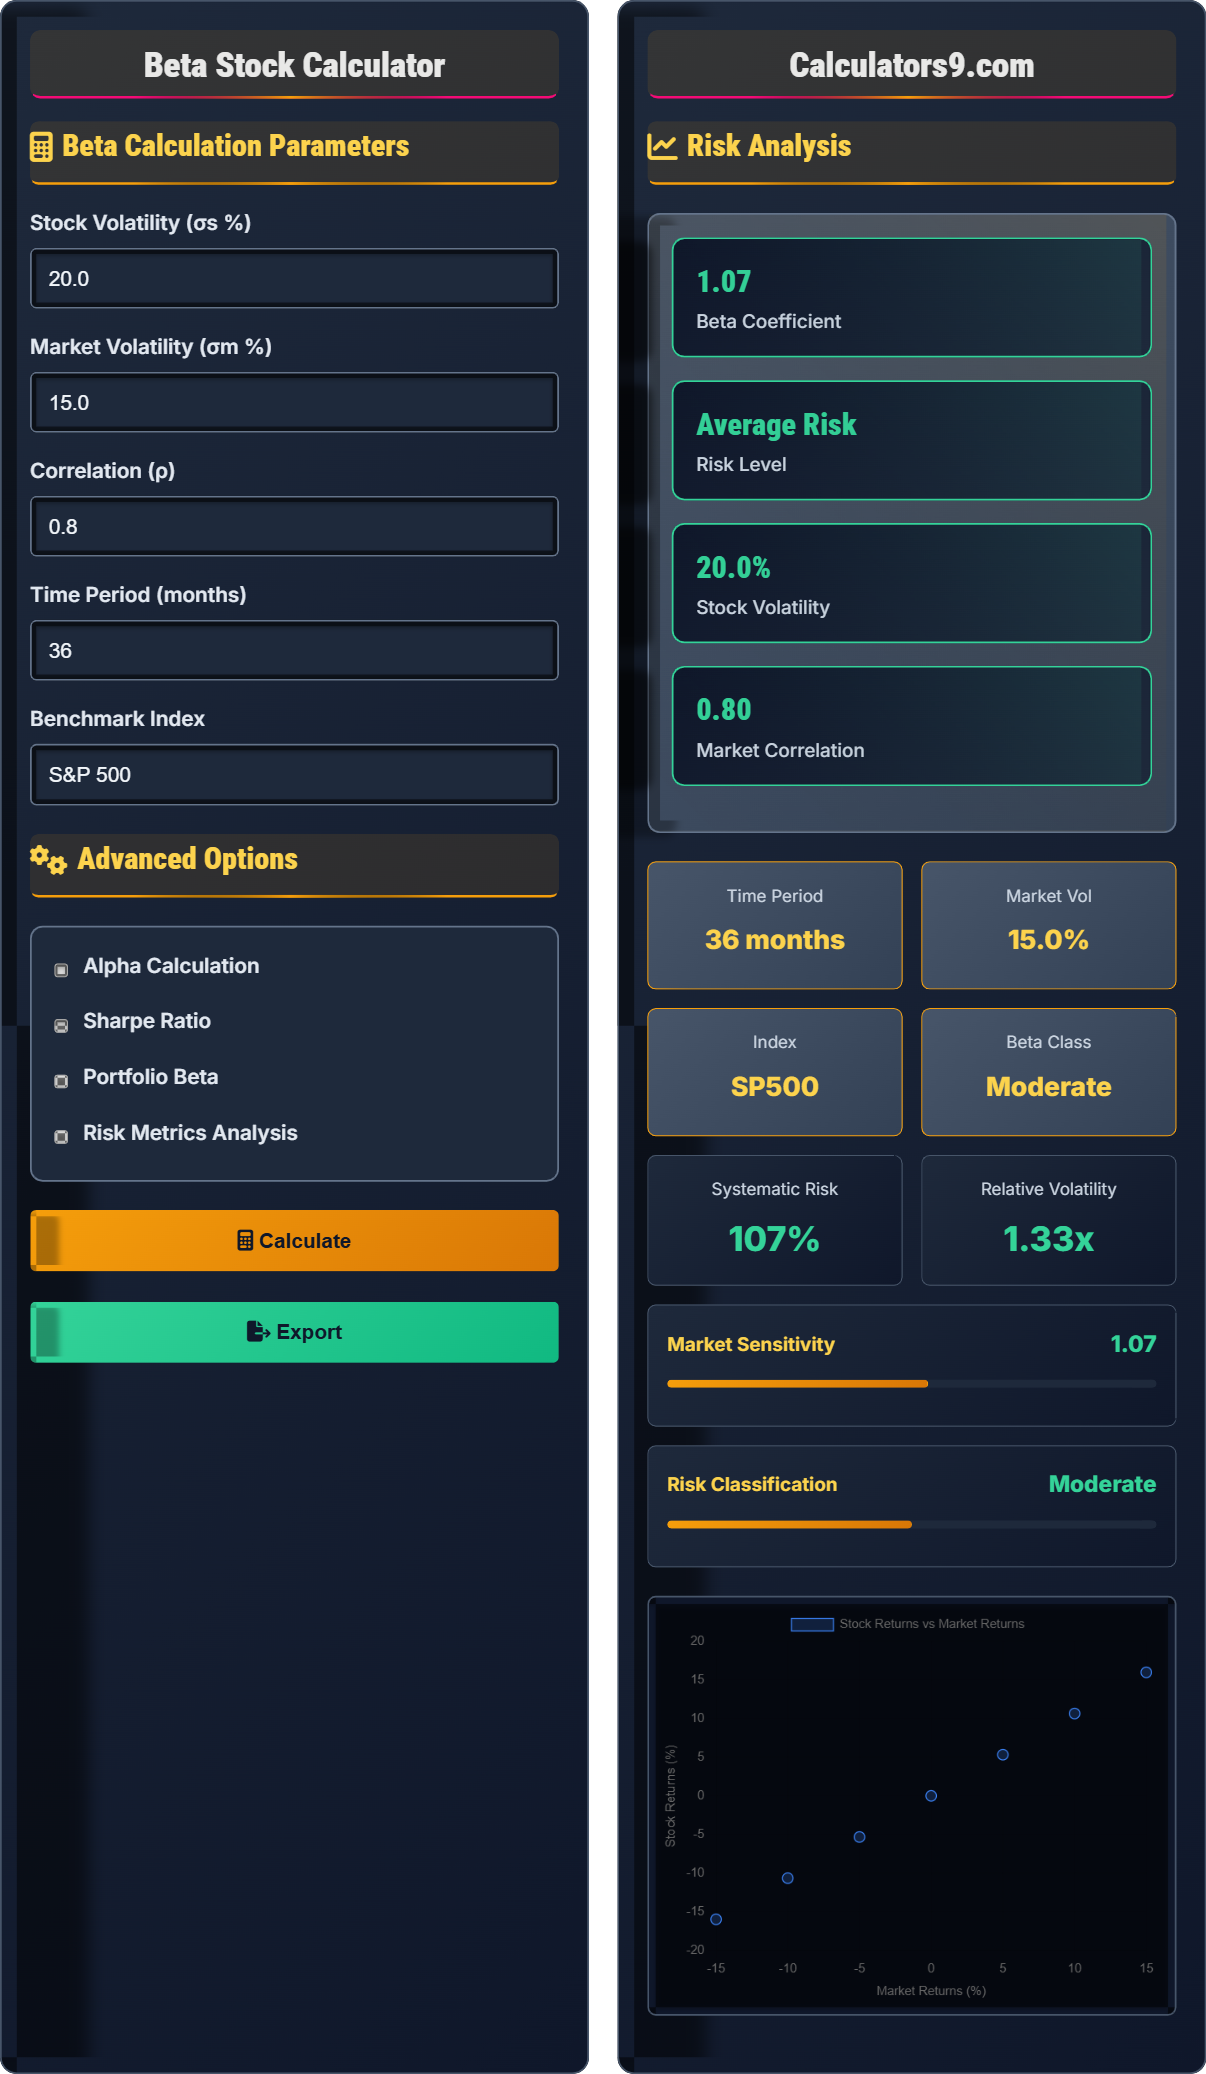
Example: If a stock has a correlation of 0.8 with the market, stock volatility of 20%, and market volatility of 15%, then β = (0.8 × 0.20) / 0.15 = 1.07. This means the stock is slightly more volatile than the market.
Beta Calculation Parameters
Advanced Options
Risk Analysis
| Metric | Value | Interpretation |
|---|
| Risk Metric | Value | Significance |
|---|
| Portfolio Component | Weight | Beta |
|---|
Beta Coefficient Fundamentals
Beta (β) is a measure of a stock's volatility in relation to the overall market. It quantifies the systematic risk of an investment, which cannot be diversified away. A beta of 1 indicates the stock moves with the market, while values above or below 1 indicate greater or lesser volatility respectively.
Where:
- \( \beta < 0 \) = Inverse correlation to market movements
- \( 0 < \beta < 1 \) = Defensive stock, lower volatility
- \( \beta = 1 \) = Moves in sync with market
- \( \beta > 1 \) = Aggressive stock, higher volatility
- Beta of 1: Stock moves with the market (benchmark)
- Beta > 1: More volatile than market (higher risk)
- Beta < 1: Less volatile than market (lower risk)
- Beta < 0: Moves opposite to market (rare)
- Time Period: 36-60 months typically used for calculation
Beta Risk Classification
Investment Strategy Considerations
- Low Beta Strategy: Focus on defensive stocks for stability during market downturns
- Beta Matching: Match portfolio beta to market exposure preferences
- Beta Rotation: Increase beta during bull markets, decrease during bear markets
- Diversification: Combine high and low beta stocks for balanced risk
- Market Timing: Use beta to adjust portfolio sensitivity to market conditions
- Beta predicts future performance (it only measures historical correlation)
- Higher beta always means higher returns (risk and return are not perfectly correlated)
- Beta captures all types of risk (it only measures systematic risk)
- Static beta values (betas change over time)
- Beta is the only risk measure needed (other metrics like alpha, Sharpe ratio are important)
Beta Coefficient Quiz
A stock has a beta of 1.5. How does this stock behave relative to the market?
The answer is B) Moves 50% more than the market. A beta of 1.5 means the stock is 50% more volatile than the market. If the market goes up 10%, the stock is expected to go up 15% (10% × 1.5). If the market falls 10%, the stock is expected to fall 15%.
Beta measures the sensitivity of a stock's returns to market returns. A beta of 1.5 indicates that for every 1% change in the market, the stock tends to change by 1.5%. This makes it a leveraged play on market movements, amplifying both gains and losses. Understanding this relationship is crucial for portfolio construction and risk management.
Beta Coefficient: Measure of systematic risk relative to market
Systematic Risk: Market-wide risk that cannot be diversified
Volatility: Degree of variation in trading price over time
• Beta = 1: Stock moves with the market
• Beta > 1: Stock more volatile than market
• Beta < 1: Stock less volatile than market
• Beta is a measure of relative volatility, not absolute risk
• Beta changes over time based on company fundamentals
• Compare beta values only within the same time period
• Confusing beta with total risk (includes unsystematic risk)
A portfolio consists of 40% Stock A (β = 1.2), 30% Stock B (β = 0.8), and 30% Stock C (β = 1.5). Calculate the portfolio's beta and interpret its risk level. If the market increases by 10%, what would be the expected portfolio return?
Portfolio Beta = (Weight A × Beta A) + (Weight B × Beta B) + (Weight C × Beta C) = (0.40 × 1.2) + (0.30 × 0.8) + (0.30 × 1.5) = 0.48 + 0.24 + 0.45 = 1.17. The portfolio has a beta of 1.17, meaning it's 17% more volatile than the market. If the market increases by 10%, the expected portfolio return would be 10% × 1.17 = 11.7%.
This portfolio has above-average systematic risk, meaning it will amplify market movements. Investors can expect higher returns during market upswings but also larger losses during downturns.
Portfolio beta is the weighted average of the individual stock betas, where weights are the proportion of each stock in the portfolio. This demonstrates how diversification affects systematic risk - combining stocks with different betas creates a portfolio with intermediate risk. The formula shows that portfolio risk can be managed by adjusting the allocation of different beta stocks.
Portfolio Beta: Weighted average of individual security betas
Systematic Risk: Non-diversifiable market risk
Asset Allocation: Distribution of investments across different assets
• Portfolio β = Σ(Weight × Individual β)
• Beta only measures systematic (non-diversifiable) risk
• Portfolio beta affects expected returns via CAPM
• Use beta to target desired portfolio risk level
• Combine high and low beta stocks for risk balancing
• Recalculate portfolio beta when allocations change
• Forgetting to weight betas by portfolio allocation
• Adding betas arithmetically instead of weighting them
• Confusing portfolio beta with individual stock betas
Investment Q&A
Q: What does a negative beta mean?
A: A negative beta means the stock tends to move in the opposite direction of the market. When the market goes up, a negative beta stock typically goes down, and vice versa. Examples include gold mining companies during market turmoil or inverse ETFs.
However, truly negative beta stocks are rare and usually occur in specific market conditions. Most assets have positive correlation with the market over the long term. Negative beta can provide diversification benefits during market downturns.
Q: How often should I recalculate beta for my holdings?
A: Beta should be recalculated quarterly or semi-annually for actively managed portfolios. For long-term holdings, annual recalculation may suffice. Beta changes over time as company fundamentals, market conditions, and correlations evolve.
Key times to recalculate include after major corporate events (earnings announcements, mergers, leadership changes), significant market shifts, or when rebalancing your portfolio. More frequent calculation is advisable during volatile market periods.