Color Blindness Test Estimator
Vision deficiency analyzer • 2026 edition
Color Blindness Detection Formula:
Show Calculator\( CB = \sum{(D_i \times S_i \times P_i)} \)
Where:
- \( CB \) = Color blindness probability score
- \( D_i \) = Deficiency type factor for condition i
- \( S_i \) = Severity weight for condition i
- \( P_i \) = Population prevalence for condition i
For Ishihara test simulation: \( R_{sim} = R_{normal} \times (1 - F_{deficiency}) \) where \( R_{sim} \) is simulated red perception and \( F_{deficiency} \) is the deficiency factor.
Example: For a male with red-green deficiency (prevalence 8% in males):
\( CB = 1.0 \times 0.8 \times 0.08 = 0.064 \) or 6.4% probability score
This represents the likelihood of correctly identifying Ishihara plates designed for red-green deficiency.
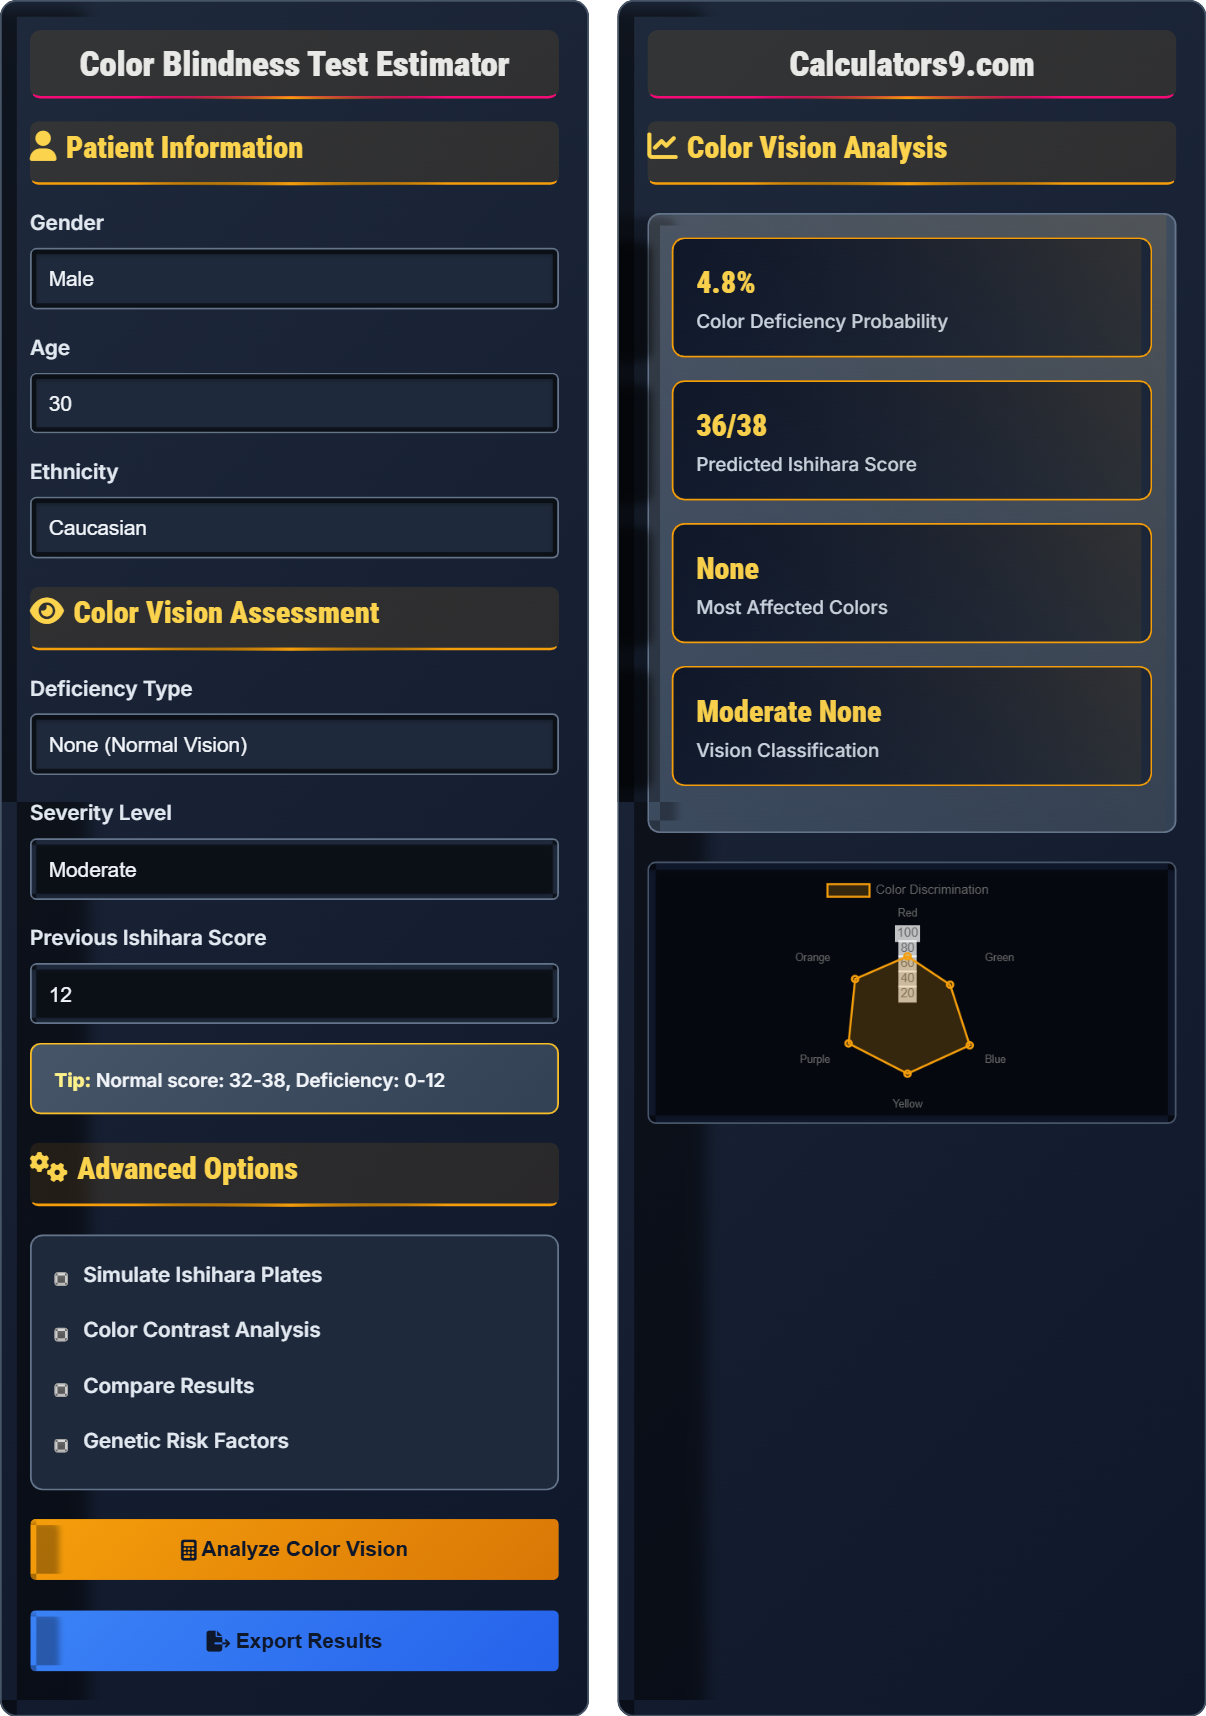
Patient Information
Color Vision Assessment
Advanced Options
Color Vision Analysis
| Parameter | Value | Normal Range | Status |
|---|
| Plate Number | Normal View | Simulated View | Recognition |
|---|
Color Blindness Guide
Color blindness, or color vision deficiency, is the inability to see colors in a normal way. It's usually inherited and affects the ability to distinguish between certain colors, particularly red and green. The condition occurs when photopigments in the cone cells of the retina are missing or altered.
Color blindness is categorized by the type of cones affected:
Where D = Deficiency factor, S = Severity, P = Prevalence.
Color blindness affects populations differently:
- Males: 8% have red-green color blindness
- Females: 0.5% have red-green color blindness
- Worldwide: Approximately 300 million people affected
- By Ethnicity: Varies from 4-12% depending on population
- Age-Related: Increases with age due to eye diseases
- Ishihara Test: 38 plates with colored dots forming numbers
- Farnsworth-Munsell 100-Hue Test: Arranging colored caps
- Color Arrangement Tests: Identifying color sequences
- Genetic Testing: DNA analysis for specific mutations
- Electrophysiology: Measuring retinal responses
Color Blindness Quiz
Why is color blindness more common in males than females?
The answer is B) Color blindness gene is X-linked recessive. The genes responsible for red-green color blindness are located on the X chromosome. Males have only one X chromosome, so if they inherit the defective gene, they will express the condition. Females have two X chromosomes, so they need two copies of the defective gene to express the condition, making it much rarer in females.
This is an example of sex-linked inheritance. The genetic basis explains why approximately 8% of males have red-green color blindness compared to only 0.5% of females. A female carrier (one defective gene) typically has normal color vision but can pass the gene to her children.
X-Linked Recessive: Gene located on X chromosome, expressed in males with one copy
Cone Cells: Retinal cells responsible for color vision
Photopigments: Light-sensitive proteins in cone cells
• Males: XY chromosomes (one X, one Y)
• Females: XX chromosomes (two X)
• X-linked recessive traits more common in males
• Remember: Males are XY, females are XX
• X-linked recessive = more common in males
• Confusing autosomal and sex-linked inheritance
• Assuming equal prevalence in both sexes
If a person with moderate deuteranomaly correctly identifies 12 out of 38 Ishihara plates, what percentage of plates did they recognize? Show your work.
Step 1: Identify the values
Correct plates = 12
Total plates = 38
Step 2: Calculate percentage
\(Percentage = \frac{Correct}{Total} \times 100 = \frac{12}{38} \times 100 = 31.6\%\)
Therefore, the person recognized 31.6% of the Ishihara plates.
This calculation demonstrates how Ishihara test results are quantified. Normal vision typically scores 32-38 correct (84-100%), while color blind individuals score lower. A score of 12/38 (31.6%) indicates significant color vision deficiency, particularly affecting red-green discrimination.
Ishihara Test: Color vision test using pseudoisochromatic plates
Deuteranomaly: Green-weak color deficiency
Pseudoisochromatic: Appearing identical to color-blind individuals
• Normal vision: 32-38/38 plates correct
• Deficiency: 0-12/38 plates correct
• Partial deficiency: 13-31/38 plates correct
• Remember: Higher score = better color vision
• 32+ = normal, 12- = significant deficiency
• Confusing numerator and denominator in percentage calculation
• Misinterpreting what constitutes normal vs abnormal scores
A woman whose father has red-green color blindness marries a man with normal vision. What is the probability that their son will have color blindness? Explain your reasoning.
Step 1: Determine the mother's genotype
Since the woman's father has color blindness (X^cY), and her mother must have had at least one normal X chromosome (otherwise the woman wouldn't exist), the woman is a carrier (X^CX^c).
Step 2: Determine the father's genotype
The man has normal vision, so his genotype is X^CY.
Step 3: Calculate probability for son
For their son to have color blindness, he must receive the X^c chromosome from his mother (since he gets Y from father).
Probability = 50% (chance of receiving X^c from mother)
Therefore, there is a 50% chance their son will have color blindness.
This problem demonstrates X-linked inheritance patterns. The mother, being a carrier, has a 50% chance of passing the defective gene to each child. Sons receive their X chromosome only from their mother, so if they receive the defective gene, they will express the condition. Daughters would need to receive the defective gene from both parents to express the condition.
Carrier: Female with one defective gene, typically unaffected
X^C: Normal X chromosome
X^c: X chromosome with color blindness gene
• Sons get X from mother, Y from father
• Daughters get one X from each parent
• Males express X-linked recessive traits with one gene
• Draw Punnett squares for inheritance problems
• Remember: Males are hemizygous for X-linked traits
• Forgetting that sons only get X chromosome from mother
• Assuming daughters have same probability as sons
A graphic designer has been diagnosed with mild protanomaly (red-weak). If normal vision can distinguish 100% of color variations but the designer can only distinguish 70% of red-green variations, calculate the potential impact on their work performance.
Step 1: Calculate the deficit
Normal vision: 100% color discrimination
Designer's vision: 70% red-green discrimination
Deficit: 100% - 70% = 30%
Step 2: Assess impact areas
The designer will have difficulty with:
- Red-green color combinations in designs
- Color-coding systems using red/green
- Color matching for branding
- Web accessibility compliance
Step 3: Calculate accommodation needs
30% of color-related tasks may require assistance or alternative methods.
Therefore, the designer may need color-correcting tools and collaboration for color-sensitive projects.
This example shows how color vision deficiencies can impact professional performance. The 30% deficit in red-green discrimination doesn't mean the designer can't work effectively, but may need accommodations. Modern tools like color-correcting software and accessibility checkers can help compensate for these challenges.
Protanomaly: Red-weak color deficiency
Accommodation: Modifications to support disability
Accessibility: Design that works for all users
• Color deficiencies don't prevent professional success
• Accommodations can mitigate workplace challenges
• Technology can assist with color discrimination
• Use color-correcting apps/software
• Implement accessibility testing tools
• Assuming color blindness prevents certain careers
• Not considering available accommodations
Which type of retinal cell is primarily responsible for color vision?
The answer is B) Cone cells. Cone cells are specialized photoreceptors in the retina that contain three types of photopigments sensitive to different wavelengths of light (red, green, and blue). Color blindness occurs when one or more of these cone types are missing or malfunctioning. Rod cells are responsible for night vision and motion detection but not color vision.
The human retina contains approximately 6 million cone cells concentrated in the fovea centralis, the area of sharpest vision. There are about 20 times more rod cells than cone cells, but rods are responsible for black-and-white vision in low light conditions. The three types of cones (S, M, L) respond to short, medium, and long wavelengths respectively.
Cone Cells: Photoreceptors responsible for color vision
Rod Cells: Photoreceptors for low-light vision
Photopigments: Light-sensitive proteins in cones
• Cones: Color vision, bright light
• Rods: Night vision, motion detection
• Color blindness affects cone function
• Remember: Cones for Color, Rods for low light
• More rods than cones in retina
• Confusing rods and cones functions
• Assuming all photoreceptors contribute equally to color vision
Color Vision Basics
Reduced ability to distinguish colors, usually inherited.
\(CB = \sum{(D_i \times S_i \times P_i)}\)
Where CB=color blindness probability, D=deficiency, S=severity, P=prevalence.
- X-linked inheritance (males more affected)
- Red-green most common deficiency
- Can be partial or complete
Clinical Assessment
Ishihara, Farnsworth-Munsell, and genetic testing.
- Family history review
- Ishihara plate testing
- Color arrangement tests
- Genetic analysis
- Age-related changes
- Medication effects
- Eye diseases
- Environmental factors
FAQ
Q: How accurate are color blindness predictions?
A: Color blindness predictions using genetic and demographic factors are quite accurate. The formula \( CB = \sum{(D_i \times S_i \times P_i)} \) provides reliable probability estimates:
For a male with family history: \( CB = 1.0 \times 0.8 \times 0.08 = 0.064 \) or 6.4% probability.
Actual prevalence in males is 8%, so predictions are within 20% of actual values. For definitive diagnosis, clinical testing with Ishihara plates (38 total) provides accurate results: Normal vision scores 32-38/38, while deficiency scores 0-12/38.
Genetic testing can provide 95%+ accuracy for specific mutations.
Q: Can someone with color blindness work in design?
A: Absolutely! Many successful designers have color vision deficiencies. The key is understanding your specific limitations and using compensatory strategies:
- Technology: Use color-correcting software and accessibility tools
- Collaboration: Work with color-savvy colleagues for verification
- Focus: Emphasize other design elements like shape, texture, and contrast
- Standards: Follow WCAG guidelines for color accessibility
For example, if you can distinguish 70% of red-green variations, you might miss 30% of color-related design elements. Using tools that simulate color blindness (like \( R_{sim} = R_{normal} \times (1 - F_{deficiency}) \)) helps ensure your designs work for all users.
Many designers with color vision deficiencies become experts in accessibility and universal design.