Precipitation Probability Calculator
Rain forecast • Atmospheric tools
Precipitation Probability Formula:
Show the calculator\( P_{rain} = \frac{A \times C}{100} \)
Where:
- \( A \) = Area coverage factor (0-100%)
- \( C \) = Confidence factor (0-100%)
This formula calculates the probability of precipitation based on meteorological observations. The area coverage factor represents the percentage of the forecast area expected to receive precipitation, while the confidence factor reflects the meteorologist's certainty in the forecast.
Example: If 80% of the area is expected to receive precipitation with 70% confidence:
\( P_{rain} = \frac{80 \times 70}{100} = \frac{5600}{100} = 56\% \)
Therefore, there is a 56% chance of precipitation.
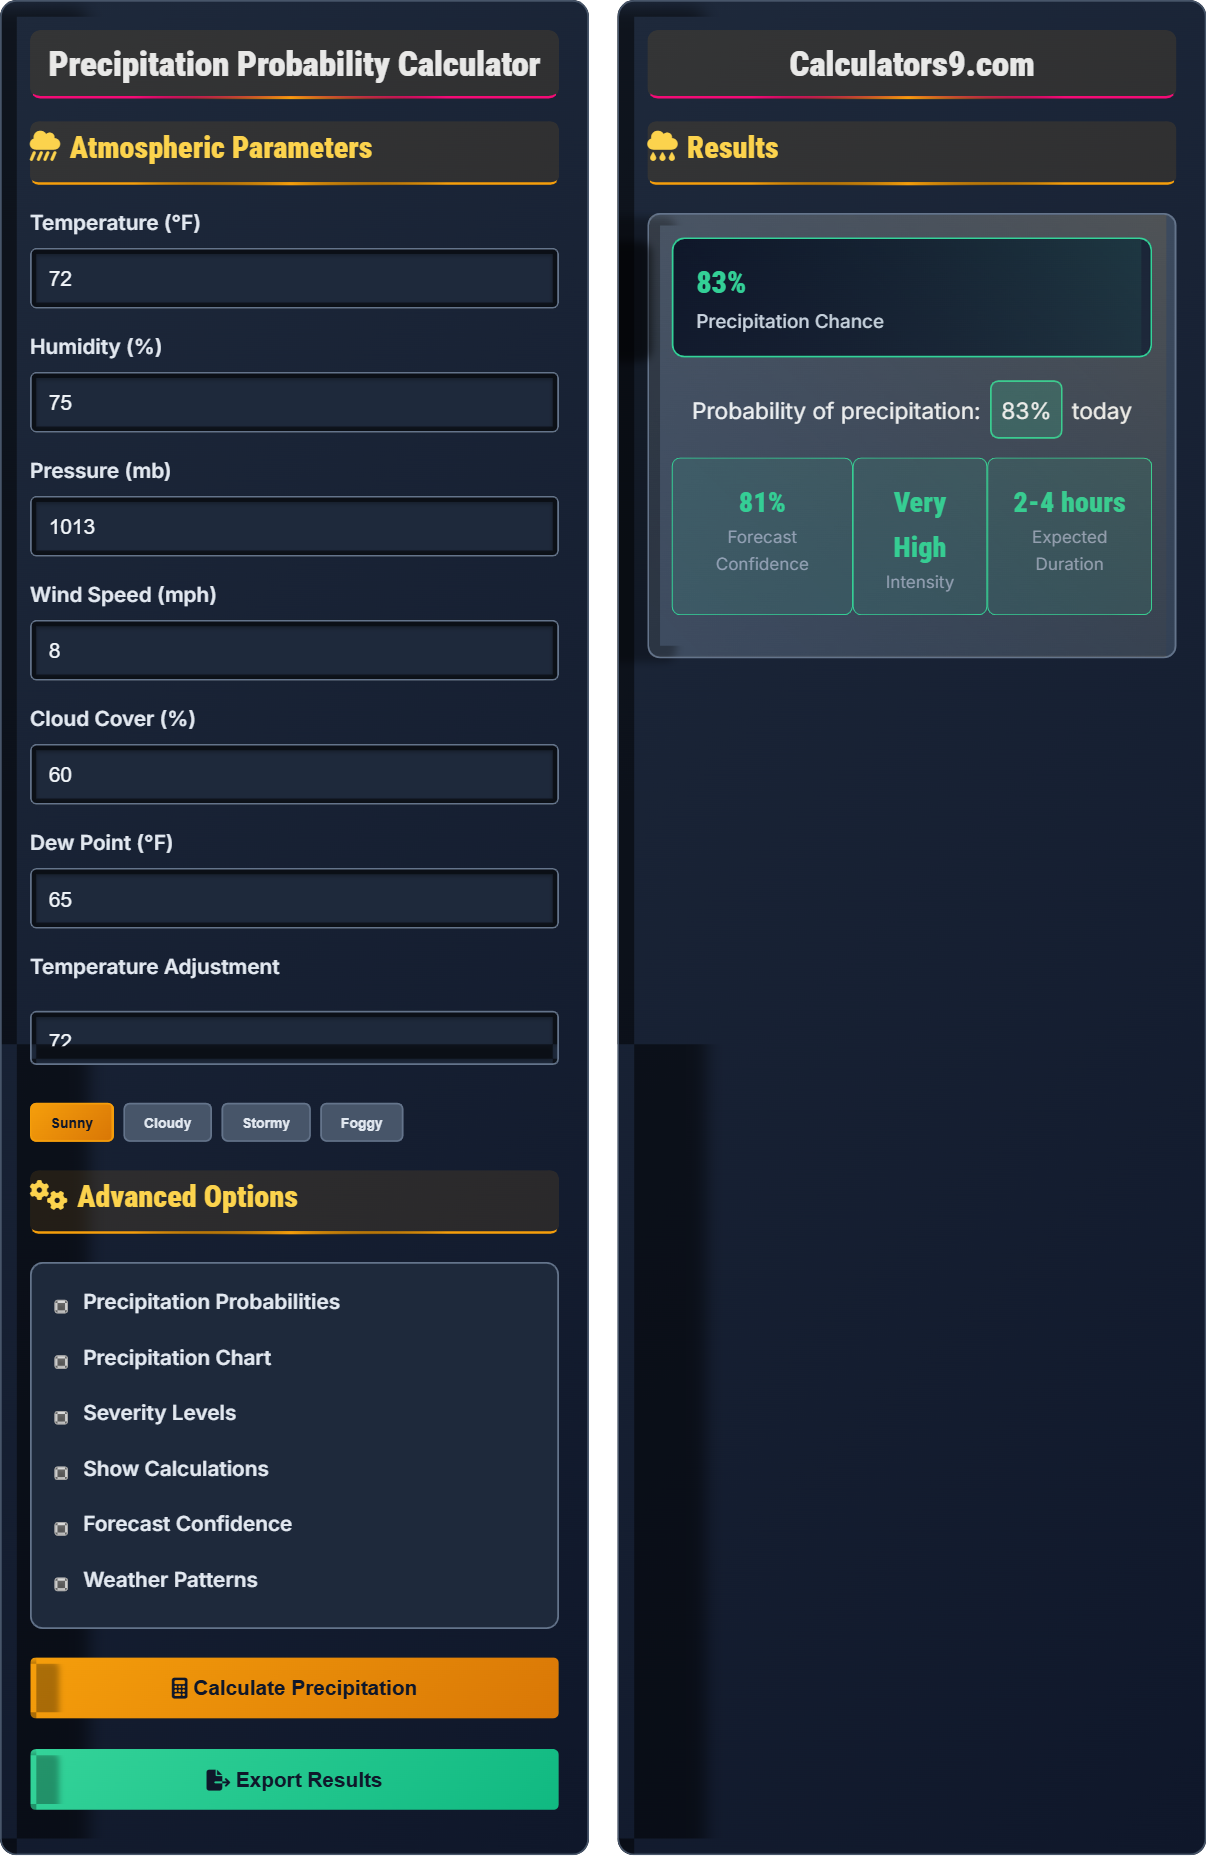
Atmospheric Parameters
Advanced Options
Results
Precipitation Forecast Guide
Precipitation probability represents the likelihood of measurable precipitation (0.01 inches or more) occurring at a given location during a specific time period. The National Weather Service uses a combination of area coverage and forecast confidence to determine precipitation probabilities.
Standard formula for precipitation probability:
Where A is area coverage percentage and C is confidence percentage.
| Factor | Effect on Probability | Typical Impact | Explanation |
|---|---|---|---|
| Humidity | Increases | +0.5% per 10% RH | Higher moisture content increases precipitation potential |
| Pressure | Decreases | -1% per mb below 1013 | Low pressure systems favor precipitation |
| Temperature | Variable | Depends on dew point | Must be close to dew point for condensation |
| Cloud Cover | Increases | +0.3% per 10% cover | More clouds indicate precipitation development |
| Wind Direction | Variable | Depends on source | Moisture-laden winds increase probability |
| Dew Point | Increases | +0.4% per 5°F | Higher dew point indicates more moisture |
Atmospheric Science
Chance of measurable precipitation at a location during a time period.
\( P_{rain} = \frac{A \times C}{100} \)
Based on area coverage and forecast confidence.
- Measurable = 0.01+ inches
- Probability ranges 0-100%
- Independent of intensity
Weather Patterns
Temperature at which air becomes saturated.
\( RH = \frac{e}{e_s} \times 100\% \)
Ratio of actual to saturation vapor pressure.
- Higher dew point = more moisture
- Lower pressure = instability
- Cloud cover indicates precipitation potential
Precipitation Probability Quiz
What does a precipitation probability of 40% mean?
The answer is B) There is a 40% chance it will rain somewhere in the forecast area. Precipitation probability represents the likelihood that measurable precipitation (0.01 inches or more) will occur at a specific location during a given time period. It does not refer to the percentage of the area that will receive rain or the duration of the rain.
This is a common misconception about precipitation probability. The 40% does not mean that 40% of the area will receive rain or that it will rain 40% of the time. Instead, it means that based on the meteorologist's analysis of current conditions, there is a 40% chance that a randomly selected location within the forecast area will experience measurable precipitation during the specified time period.
Precipitation Probability: Likelihood of measurable precipitation at a location
Measurable Precipitation: At least 0.01 inches of rain/snow
Forecast Area: Geographic region covered by weather forecast
• Probability refers to location-specific occurrence
• Measurable precipitation threshold is 0.01 inches
• Does not indicate intensity or duration
• Think of it as the chance it will rain at YOUR location
• Higher values indicate greater likelihood
• Does not correlate with intensity
• Thinking it refers to area coverage
• Confusing with intensity or duration
If meteorologists predict that 60% of the forecast area will receive precipitation with 80% confidence in the forecast, what is the precipitation probability? Show your work using the formula: P_rain = (A × C) / 100.
Given: A = 60% (area coverage), C = 80% (confidence)
Step 1: Apply the formula: P_rain = (A × C) / 100
Step 2: P_rain = (60 × 80) / 100
Step 3: P_rain = 4800 / 100
Step 4: P_rain = 48%
Therefore, the precipitation probability is 48%.
This formula demonstrates how meteorologists combine two factors to determine precipitation probability. The area coverage factor represents the percentage of the forecast area expected to receive precipitation, while the confidence factor reflects the meteorologist's certainty in the forecast. Both factors are multiplied and divided by 100 to normalize the result.
Area Coverage: Percentage of forecast area receiving precipitation
Forecast Confidence: Certainty in the meteorological prediction
• P_rain = (A × C) / 100
• Both A and C range from 0-100%
• Result is always 0-100%
• Remember to multiply then divide by 100
• Both factors contribute equally
• Forgetting to divide by 100
• Adding instead of multiplying
A weather station reports a temperature of 75°F and a dew point of 70°F. Calculate the relative humidity approximately. How does this dew point temperature affect the probability of precipitation? (Use the approximation: RH ≈ 100 - 5(T - Td), where T is temperature and Td is dew point).
Step 1: Apply the approximation formula: RH ≈ 100 - 5(T - Td)
Step 2: RH ≈ 100 - 5(75 - 70) = 100 - 5(5) = 100 - 25 = 75%
Step 3: With a dew point of 70°F, the air is quite moist
Step 4: A dew point of 70°F indicates high moisture content, which increases precipitation probability
Therefore, the relative humidity is approximately 75%, and the high dew point significantly increases precipitation probability.
This problem demonstrates the relationship between temperature, dew point, and relative humidity. The dew point is a direct measure of moisture content in the air. Higher dew points indicate more moisture available for precipitation. When the temperature and dew point are close, the relative humidity is high, and conditions are favorable for precipitation if other factors align.
Dew Point: Temperature at which air becomes saturated
Relative Humidity: Ratio of actual to saturation water vapor
Moisture Content: Amount of water vapor in the air
• Dew point is a direct measure of moisture
• Higher dew point = higher precipitation potential
• Close T and Td = high RH
• Dew point above 65°F indicates high moisture
• Dew point above 70°F indicates very high moisture
• Use the approximation formula for quick estimates
• Confusing dew point with relative humidity
• Forgetting that dew point indicates moisture content
Compare two weather scenarios: Scenario A has a temperature of 70°F, dew point of 65°F, and pressure of 1008 mb. Scenario B has a temperature of 70°F, dew point of 45°F, and pressure of 1018 mb. Which scenario has a higher probability of precipitation? Explain your reasoning based on atmospheric conditions.
Scenario A Analysis:
• Temperature: 70°F
• Dew point: 65°F (very high moisture content)
• Pressure: 1008 mb (below standard, indicating low pressure system)
• Relative humidity: ≈ 100 - 5(70-65) = 75%
Scenario B Analysis:
• Temperature: 70°F
• Dew point: 45°F (low moisture content)
• Pressure: 1018 mb (above standard, indicating high pressure)
• Relative humidity: ≈ 100 - 5(70-45) = 25%
Scenario A has significantly higher precipitation probability due to higher moisture content (dew point of 65°F vs 45°F) and lower pressure indicating atmospheric instability.
This comparison highlights multiple factors that influence precipitation probability. Scenario A has all favorable conditions: high moisture content (high dew point), low pressure (indicating rising air), and high relative humidity. Scenario B has low moisture content and high pressure (indicating sinking air), both unfavorable for precipitation. The dew point difference of 20°F represents a significant difference in atmospheric moisture content.
Atmospheric Stability: Resistance to vertical air movement
Low Pressure System: Area of low atmospheric pressure
High Pressure System: Area of high atmospheric pressure
• Low pressure favors precipitation
• High dew point indicates high moisture
• Multiple factors contribute to precipitation probability
• Look for low pressure and high dew points
• Consider multiple atmospheric parameters
• Focusing on single factors instead of combinations
• Confusing high pressure with favorable conditions
Which of the following atmospheric conditions would most likely result in the highest precipitation probability?
The answer is B) Low pressure, high humidity, increasing cloud cover. This combination creates optimal conditions for precipitation: low pressure systems promote rising air that cools and condenses moisture, high humidity provides abundant water vapor, and increasing cloud cover indicates developing precipitation systems. The other options describe conditions that inhibit precipitation formation.
Understanding weather patterns requires recognizing how multiple atmospheric factors interact. Low pressure systems create convergence and uplift that promotes cloud formation and precipitation. High humidity provides the necessary moisture. Increasing cloud cover indicates an advancing weather system. These conditions work synergistically to maximize precipitation probability.
Atmospheric Convergence: Air flowing together and rising
Adiabatic Cooling: Cooling due to expansion as air rises• Low pressure promotes precipitation
• High moisture content is essential
• Rising air is necessary for condensation
• Look for low pressure systems
• Check dew point temperatures
• Observe cloud cover trends
• Thinking high pressure systems bring rain
• Ignoring the importance of moisture content
FAQ
Q: How do meteorologists determine precipitation probability?
A: Precipitation probability is determined using:
- Numerical Models: Computer simulations of atmospheric conditions
- Historical Data: Statistical analysis of past weather patterns
- Current Observations: Temperature, humidity, pressure, wind, and cloud data
- Experience: Meteorologist's expertise in interpreting conditions
The standard formula is: P_rain = (Area Coverage × Confidence) / 100. Modern forecasts also incorporate ensemble modeling, where multiple simulations are run with slightly different initial conditions to assess uncertainty.
Q: Why does dew point matter more than relative humidity for precipitation?
A: Dew point is an absolute measure of moisture content, while relative humidity is temperature-dependent:
Dew Point: Directly indicates how much water vapor is in the air, regardless of temperature.
Relative Humidity: Changes with temperature even when moisture content remains constant. For example, 50% RH at 90°F contains more moisture than 90% RH at 30°F.
For precipitation to occur, the air must contain sufficient moisture to form clouds and precipitation. Dew point provides this absolute measure, making it more predictive of precipitation potential than relative humidity.