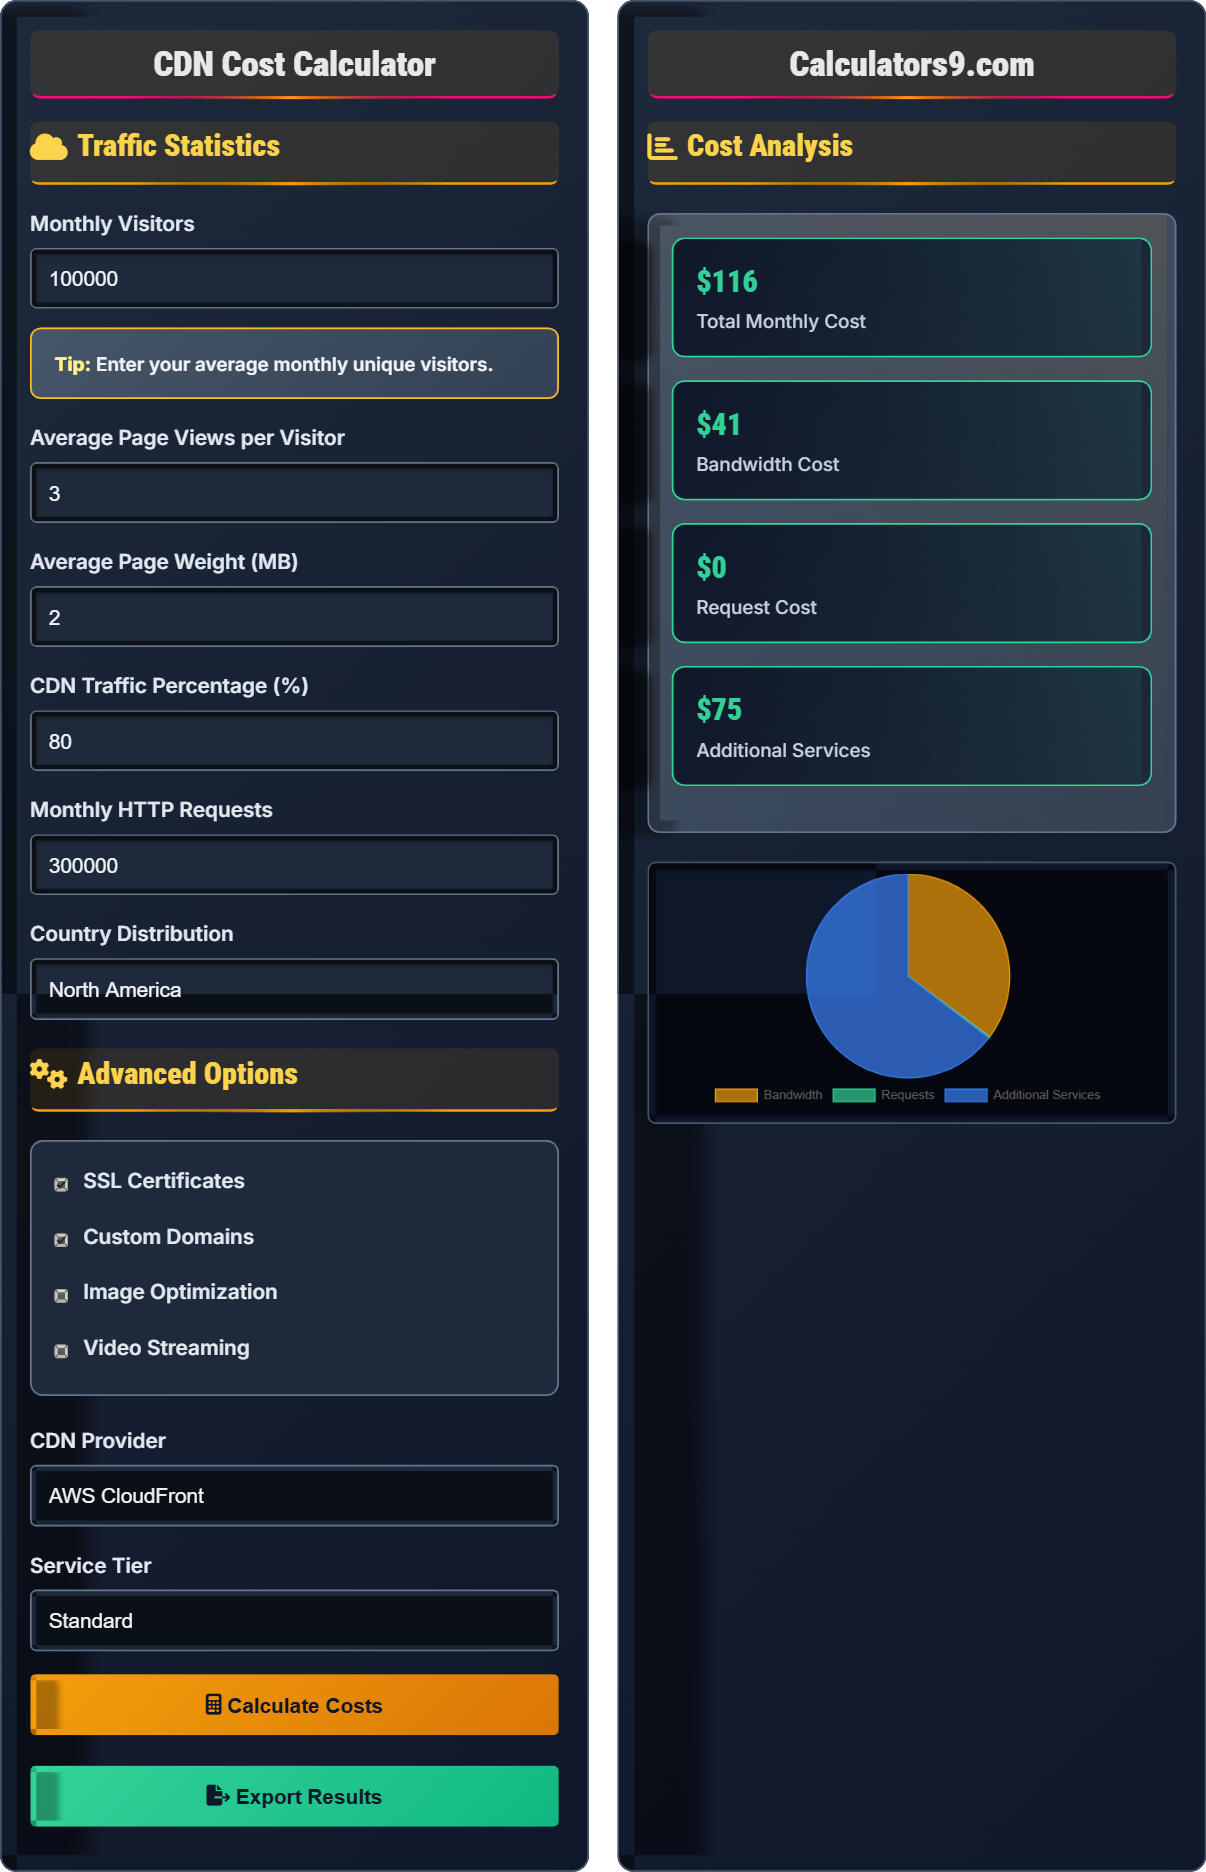
CDN Cost Calculator
Performance & pricing tool • 2026 edition
CDN Cost Calculation Formula:
Show the calculatorCDN costs are calculated using the formula:
\( \text{Total Cost} = (\text{Bandwidth} \times \text{Price Per GB}) + (\text{Requests} \times \text{Price Per Request}) + \text{Additional Fees} \)
Where:
- Bandwidth: Total data transferred (GB/month)
- Price Per GB: Cost per gigabyte transferred (varies by provider)
- Requests: Total HTTP requests served
- Price Per Request: Cost per HTTP request (usually per 10,000 requests)
- Additional Fees: SSL certificates, custom domains, premium features
This formula accounts for the primary cost drivers of CDN services: data transfer and request processing.
Traffic Statistics
Advanced Options
Cost Analysis
| Component | Usage | Rate | Cost |
|---|---|---|---|
| Bandwidth (US) | 384 TB | $0.085/GB | $32,640 |
| Bandwidth (EU) | 96 TB | $0.12/GB | $11,520 |
| HTTP Requests | 300,000 | $0.0075/10K | $225 |
| HTTPS Requests | 300,000 | $0.01/10K | $300 |
| Custom Domains | 5 | $5/month | $25 |
| Image Optimization | 480 TB | $0.04/GB | $1,920 |
Comprehensive CDN Cost Guide
Content Delivery Network (CDN) pricing is typically based on usage metrics including data transfer (bandwidth), HTTP requests, and additional services. Major providers like AWS CloudFront, Cloudflare, Azure CDN, and Google Cloud CDN charge differently for these components, with prices varying by geographic region and service tier.
CDN costs consist of several key components:
To minimize CDN costs:
- Enable compression: Reduce bandwidth usage with GZIP/Brotli
- Optimize TTL: Longer cache times reduce origin requests
- Use appropriate image formats: WebP, AVIF for smaller file sizes
- Implement smart caching: Cache static content longer
- Monitor usage: Identify cost-saving opportunities
- Negotiate enterprise rates: High-volume discounts
Major CDN providers offer different pricing models:
- Cloudflare: Free tier available, pay-as-you-go model
- AWS CloudFront: Tiered pricing with volume discounts
- Google Cloud CDN: Integrated with Google Cloud Platform
- Azure CDN: Microsoft's global CDN service
- Akamai: Enterprise-grade CDN with premium pricing
CDN Cost Learning Quiz
Which of the following is NOT typically a major component of CDN pricing?
The answer is C) Storage capacity. While some CDN providers offer origin storage, most CDN pricing is primarily based on bandwidth and requests rather than storage capacity. CDNs are designed to cache and deliver content efficiently, with pricing focused on the actual delivery (bandwidth) and processing (requests) rather than long-term storage.
CDNs are fundamentally different from cloud storage services. Their primary cost driver is the distribution of content to end users, which involves data transfer and request processing. While some providers offer origin storage, the cost model emphasizes usage patterns (how much data is delivered and how many requests are handled) rather than how much is stored.
CDN: Content Delivery Network for content distribution
Bandwidth: Amount of data transferred
Requests: Number of HTTP requests processed
• CDN pricing focuses on usage, not storage
• Bandwidth is typically the largest cost component
• Costs vary significantly by region
• Focus on bandwidth optimization first
• Consider regional pricing differences
• Use compression to reduce bandwidth costs
• Confusing CDN with cloud storage pricing
• Not considering regional cost differences
• Ignoring request-based charges
Calculate the monthly bandwidth usage for a website with 500,000 visitors per month, 4 page views per visitor, and an average page weight of 3 MB. Show your work.
Step 1: Calculate total page views: 500,000 visitors × 4 page views = 2,000,000 page views
Step 2: Calculate total data transfer: 2,000,000 page views × 3 MB = 6,000,000 MB
Step 3: Convert to GB: 6,000,000 MB ÷ 1,000 = 6,000 GB
Step 4: Convert to TB: 6,000 GB ÷ 1,000 = 6 TB
Therefore, the monthly bandwidth usage would be 6 TB.
This calculation demonstrates the relationship between user traffic and bandwidth consumption. The key insight is that even modest increases in page views or page weight can significantly impact total bandwidth. For example, doubling the average page weight from 3MB to 6MB would double the bandwidth requirement from 6TB to 12TB, potentially doubling CDN costs.
Bandwidth: Amount of data transferred over time
Page Weight: Total size of a web page including all assets
Page Views: Number of pages viewed by users• 1 TB = 1,000 GB
• 1 GB = 1,000 MB
• Bandwidth = Visitors × Page Views × Page Weight
• Optimize images to reduce page weight
• Use compression to reduce file sizes
• Monitor page weight trends
• Confusing MB with GB in calculations
• Not accounting for CDN traffic percentage
• Forgetting to convert units properly
A company currently spends $5,000/month on CDN with 10TB of bandwidth and 1 million requests. They want to reduce costs by 40%. If they can reduce bandwidth by 30% through optimization, what will be their new monthly cost assuming the same pricing structure? Calculate the potential savings and explain the optimization strategies.
Current usage: 10TB bandwidth, 1M requests, $5,000/month
After 30% bandwidth reduction: 10TB × (1 - 0.3) = 7TB
If the original cost was $5,000 for 10TB, the cost for 7TB would be: $5,000 × (7/10) = $3,500
Assuming requests remain the same, the new monthly cost would be approximately $3,500.
Potential savings: $5,000 - $3,500 = $1,500/month (30% reduction)
Optimization strategies include: image compression, enabling GZIP/Brotli, using efficient formats (WebP), implementing proper caching headers, and reducing unnecessary assets.
This example demonstrates that bandwidth optimization directly correlates with cost reduction. The 30% reduction in bandwidth results in a proportional cost reduction. However, the company aimed for 40% cost reduction, indicating that additional optimizations beyond bandwidth reduction (like request optimization or negotiating better rates) would be needed to reach their target.
Cost Optimization: Reducing expenses while maintaining performance
Bandwidth Reduction: Decreasing data transfer volume
Cost Proportionality: Linear relationship between usage and cost
• Bandwidth costs are typically linear with usage
• Image optimization can reduce bandwidth by 50-80%
• Proper caching reduces origin requests
• Use modern image formats (WebP, AVIF)
• Implement responsive images
• Enable compression for all assets
• Assuming all optimizations have equal impact
• Not considering request-based charges
• Forgetting about additional service fees
A global e-commerce site serves 60% of its traffic from the US, 25% from Europe, and 15% from Asia-Pacific. Their total monthly bandwidth is 20TB. If US bandwidth costs $0.085/GB, EU costs $0.12/GB, and APAC costs $0.15/GB, calculate the total monthly cost and suggest optimization strategies.
Step 1: Calculate regional bandwidth:
US: 20TB × 60% = 12TB
EU: 20TB × 25% = 5TB
APAC: 20TB × 15% = 3TB
Step 2: Calculate regional costs:
US: 12,000GB × $0.085/GB = $1,020
EU: 5,000GB × $0.12/GB = $600
APAC: 3,000GB × $0.15/GB = $450
Step 3: Total monthly cost: $1,020 + $600 + $450 = $2,070
Optimization strategies: Use regional CDN providers, optimize for higher-cost regions first, consider local hosting in expensive regions.
This problem highlights how geographic distribution affects CDN costs. The same total bandwidth has different costs depending on where it's delivered. APAC traffic costs 76% more per GB than US traffic, making it crucial to optimize content delivery in expensive regions. This demonstrates why global companies need to consider regional pricing when designing their CDN strategy.
Regional Pricing: Different costs based on geographic location
Geographic Distribution: Traffic patterns across regions
Cost Optimization: Reducing expenses based on regional differences
• CDN costs vary significantly by region
• APAC and South America typically have higher costs
• US and Europe generally have lower costs
• Negotiate regional pricing with providers
• Use local CDN providers in expensive regions
• Optimize content for highest-cost regions first
• Assuming uniform pricing globally
• Not considering regional traffic distribution
• Ignoring regional optimization opportunities
Which CDN provider typically offers the most competitive pricing for high-volume traffic?
The answer is B) AWS CloudFront. AWS CloudFront typically offers competitive pricing for high-volume traffic due to its tiered pricing model with significant volume discounts. For very high volumes (terabytes per month), AWS often provides the best pricing, especially when combined with other AWS services. However, the actual best price depends on traffic patterns, geographic distribution, and specific feature requirements.
CDN pricing is complex and depends on multiple factors. AWS CloudFront is known for its tiered pricing structure that rewards high-volume users with significant discounts. However, the "best" provider varies based on specific use cases, traffic patterns, and feature requirements. It's important to calculate costs based on your actual usage patterns rather than relying on general pricing comparisons.
Tiered Pricing: Lower rates for higher usage volumes
Volume Discounts: Reduced rates for high-volume users
Feature Requirements: Specific functionality needs
• Volume discounts significantly impact high-volume pricing
• Geographic distribution affects regional costs
• Feature requirements may override cost considerations
• Calculate costs based on your actual usage
• Consider volume discounts for high traffic
• Factor in additional features needed
• Assuming the cheapest provider is always best
• Not considering volume discounts
• Ignoring feature differences between providers
CDN Fundamentals
Bandwidth + Requests + Additional Services = Total Cost.
(Bandwidth × Price/GB) + (Requests × Price/10K) + Fees
- Bandwidth is the largest cost component
- Regional pricing varies significantly
- Volume discounts apply for high usage
Optimization Strategies
Optimize bandwidth and requests to minimize costs.
- Enable compression (GZIP/Brotli)
- Optimize images (WebP, AVIF)
- Set appropriate cache TTL
- Implement responsive images
- Reduce unnecessary assets
- Monitor usage patterns regularly
- Consider geographic distribution
- Negotiate enterprise pricing for high volume
FAQ
Q: How can I optimize CDN costs for a high-traffic website?
A: For high-traffic websites, focus on these cost optimization strategies:
- Compression: Enable GZIP/Brotli to reduce bandwidth by 60-80%
- Image optimization: Use WebP/AVIF formats and responsive images
- Caching strategy: Set longer TTLs for static assets
- Content pruning: Remove unused assets and third-party scripts
- Regional optimization: Use regional pricing differences
- Volume discounts: Negotiate enterprise pricing for high volume
Typical savings from these optimizations range from 30-60% of CDN costs. For example, a site spending $10,000/month could reduce costs to $4,000-$7,000/month with proper optimization.
Monitor your usage patterns regularly and adjust strategies based on actual traffic distribution.
Q: What's the best CDN provider for startups with limited budgets?
A: For startups with limited budgets, consider these options:
- Cloudflare: Offers a generous free tier with 100,000 requests/day
- AWS CloudFront: Pay-as-you-go with no upfront costs
- Google Cloud CDN: Competitive pricing with Google Cloud Platform integration
Cloudflare's free tier is often sufficient for small to medium websites with up to 10TB/month of bandwidth. For higher traffic, AWS CloudFront typically offers the best value with tiered pricing that reduces costs as usage increases.
Start with a pay-as-you-go model and negotiate volume discounts as your traffic grows. Many startups can operate on under $100/month with proper optimization.
Always calculate your actual usage before choosing a provider - the "cheapest" option isn't always the most cost-effective for your specific traffic patterns.